Hello,
I am using :
lonOffset = -160
proj = ccrs.Mercator(lonOffset)
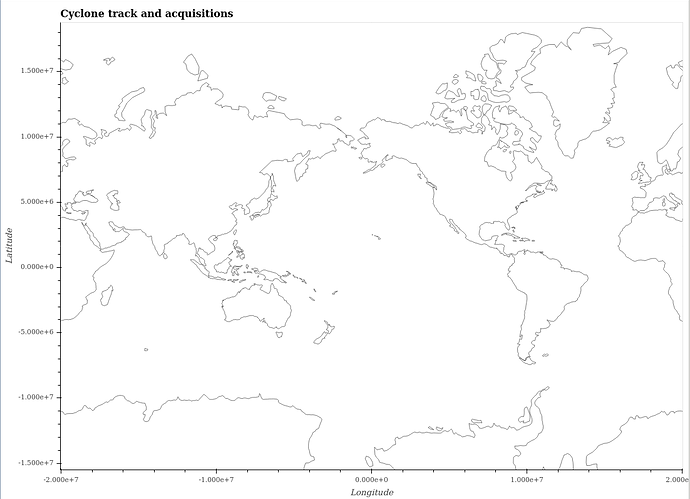
gf.coastline.opts(projection=proj, width=1100, height=800, padding=0.1,
                            axiswise=True, title="Cyclone track and acquisitions", tools=['tap'], global_extent=True)
And the result is
Is it possible to have lon/lat ticks labels ? When I use some other projection it is automatically set (GOOGLE_MERCATOR or PlateCarree)
Thanks
