No data when trying to make a real-time Dash application with Holoviews

Hi,
I’m trying to create a real-time data application to monitor sensors, by displaying the last 1000 data points with a 100ms refresh.
I’ve been able to create a Dash web app using the extendData callback on a Scattergl Plotly plot, but it uses 50% of my CPU.
I then created a Panel application, and the same graph uses less than 15% of my CPU with hvPlot:

import json
import pandas as pd
import hvplot.streamz
import holoviews as hv

from panel.widgets import IntSlider
import requests

from streamz.dataframe import PeriodicDataFrame
import redis

import panel as pn
pn.extension(sizing_mode="stretch_width")

# Connect to Redis cache
r = redis.Redis()

# Set up callback with streaming data
def sin_data(**kwargs):
    # Read the last element from the Redis list
    data = r.lindex('random_sin', -1)
    if data:
        data = json.loads(data)
        index = pd.to_datetime(data['timestamp'], unit='ms')
        return pd.DataFrame({'var_0': data['var_0'],
                           'var_1': data['var_1'],
                           'var_2': data['var_2'],
                           'var_3': data['var_3'],
                           'var_4': data['var_4'],
                           'var_5': data['var_5'],
                           'var_6': data['var_6'],
                           'var_7': data['var_7']},
                          columns=['var_' + str(x) for x in range(8)], index=[index])

df_1 = PeriodicDataFrame(sin_data, interval='100ms')

# Declare plots
line_1 = df_1.hvplot(kind='line', value_label="Sin", width=1200)


hv.extension('bokeh')
hv.renderer('bokeh').theme = 'caliber'
controls = pn.WidgetBox('# Commandes',
                       ...
                        )

#pn.Row(line_1, controls)

pn.template.FastListTemplate(
    site="Panel", 
    title="PoC", 
    sidebar=[*controls], 
    main=[
        "POC hvPlot, Bokeh, Panel",
        line_1,
    ]
).servable();

Now, I would like to use Holoviews in a Dash app to see if I can have better performances than with Plotly, so I adapted my code:

import dash
from dash import html

import holoviews as hv
from holoviews.plotting.plotly.dash import to_dash
from holoviews.streams import Buffer

import json
import pandas as pd
import hvplot.streamz
from streamz.dataframe import PeriodicDataFrame
import redis

# Connect to Redis cache
r = redis.Redis()

# Set up callback with streaming data
def sin_data(**kwargs):
    # Read the last element from the Redis list
    data = r.lindex('random_sin', -1)
    if data:
        data = json.loads(data)
        index = pd.to_datetime(data['timestamp'], unit='ms')
        return pd.DataFrame({'var_0': data['var_0'],
                           'var_1': data['var_1'],
                           'var_2': data['var_2'],
                           'var_3': data['var_3'],
                           'var_4': data['var_4'],
                           'var_5': data['var_5'],
                           'var_6': data['var_6'],
                           'var_7': data['var_7']},
                          columns=['var_' + str(x) for x in range(8)], index=[index])

df = PeriodicDataFrame(sin_data, interval='100ms')

# Declare plot
line = hv.DynamicMap(hv.Curve, streams=[Buffer(df)])

app = dash.Dash(__name__)
components = to_dash(app, [line])

app.layout = html.Div(components.children)

if __name__ == "__main__":
    app.run_server(debug=True)

But there’s only one data point from var_0 showing in the plot:

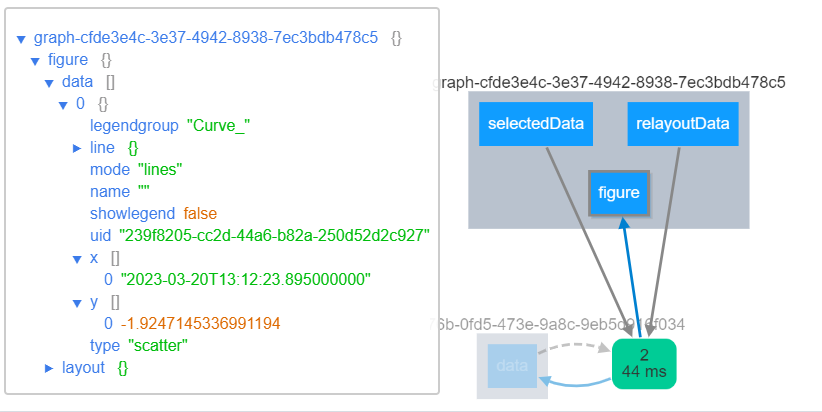
What am I doing wrong here ?

Thanks in advance!

Hi @mehdi

Welcome to the community.

I think you are seeing the difference between the Panel/ Bokeh and Dash architecture.

  • Panel/ Bokeh establishes a websocket connection that can push updates from the server to the client triggered by the PeriodicDataFrame. Panel/ Bokeh has state on the server side.
  • Dash does not open a websocket. It uses a request/ response cycle. Something in the client (browser) needs to trigger a request to the server every 100ms and Dash does not store state on the server side.

The Panel/ Bokeh approach enables faster (streaming) applications that are simpler to develop. The downside is that the Panel/ Bokeh approach is harder to scale to thousands of users.

You will probably have to ask for help in the Dash community forum to get someone who understands the Dash architecture to help.

1 Like

Hi,
Thanks for your answer. I have a better understanding of the two frameworks now, and I’ll try to dig some informations from the Dash forum.
This is kind of frustrating because I just learnt about Holoviz and I’m very interested in all these new concepts, but my project requires to work with high frequency data refreshing and the best solution seems to be an old school pyQt desktop application with pyqtgraph.

1 Like

Hi @mehdi

Why could you not use Panel + hvPlot to create the high frequency data application?

Hi @Marc
I did create a Panel application, and ran into some recurring problems while testing that, as a
whole, made me think that I could have stability problems with that solution:

  • I would sometime have the error RuntimeError: _pending_writes should be non-None when we have a document lock, and we should have the lock when the document changes and would need to reload the page or the server
  • Most of the time my requests callback wouldn’t fire

Now this morning I gave it another try, by replacing the hvplot implementation of streamz.dataframe.PeriodicDataFrame by a holoviews.DynamicMap and a holoviews.streams.Buffer and it seems way more stable.

I still have some issues with widgets not firing a request, datapoints lost when opening the app on 2 separate web navigator tabs, but it’s encouraging. I’ll dig on these issues and open another thread if necessary.

I’ll share my code here in case it can help someone:

import panel as pn, numpy as np
import holoviews as hv, pandas as pd
import asyncio

from holoviews.streams import Buffer

from tornado.ioloop import PeriodicCallback
from tornado import gen

from panel.widgets import FloatSlider
import requests
import redis
import json

pn.config.sizing_mode = 'stretch_width'
hv.extension('bokeh')

URL = 'http://localhost:5000/set_sine_params'
HEADERS = {'Content-type': 'application/json'}

# Connect to Redis cache
r = redis.Redis()

dfs = []
buffers = []
curves = []

for i in range(8):
    dfs.append(pd.DataFrame({"var_" + str(i) :np.array([])}, columns=["var_" + str(i)], index=[]))
    buffers.append(Buffer(data=dfs[i], length=1000))
    curves.append(hv.DynamicMap(hv.Curve,streams=[buffers[i]]))


@gen.coroutine
def update():
    # Read the last element from the Redis list
    data = json.loads(r.lindex('random_sin', -1))
    index = pd.to_datetime(data['timestamp'], unit='ms')
    for i in range(8):
        buffers[i].send(pd.DataFrame(
            {"var_" + str(i): data["var_" + str(i)]}, columns=["var_" + str(i)], index=[index]))

PeriodicCallback(update, 100).start()
    

# Declare widgets
@asyncio.coroutine
def change_sin_amp(event):
    data = {'amplitude': event.new}
    requests.post(URL, json=data, headers=HEADERS)
@asyncio.coroutine
def change_sin_freq(event):
    data = {'freq': event.new}
    requests.post(URL, json=data, headers=HEADERS) 
@asyncio.coroutine
def change_sin_noise(event):
    data = {'noise_amplitude': event.new}
    requests.post(URL, json=data, headers=HEADERS)

sin_amp = FloatSlider(name="Sine amplitude:", start=0.1, end=10, value=1, step = 0.1)
sin_amp.param.watch(change_sin_amp, 'value')

sin_freq = FloatSlider(name="Sine frequency:", start=0.001, end=10, value=1, step = 0.1)
sin_freq.param.watch(change_sin_freq, 'value')

sin_noise = FloatSlider(name="Sine noise:", start=0, end=10, value=0, step = 0.1)
sin_noise.param.watch(change_sin_noise, 'value')
    
hv.renderer('bokeh').theme = 'caliber'
controls = pn.WidgetBox('# Commandes',
                        sin_amp,
                        sin_freq,
                        sin_noise,
                        )


pn.template.FastListTemplate(
    site="Panel", 
    title="PoC", 
    sidebar=[*controls], 
    main=[
        "POC Panel",
        (curves[0] * curves[1] * curves[2] * curves[3] * curves[4] * curves[5] * curves[6] * curves[7]),
    ]
).servable();
1 Like