`node_color` parameter does not work with Sankey

Consider the following example:

import holoviews as hv
import pandas as pd

# Initialize Holoviews with the Bokeh backend
hv.extension('bokeh')

# Define nodes with unique string identifiers
nodes = pd.DataFrame({'index': ['A', 'B', 'C', 'D']})

# Define links with source and target as node names (strings)
links = pd.DataFrame([
    {'source': 'A', 'target': 'C', 'value': 5},
    {'source': 'B', 'target': 'C', 'value': 3},
    {'source': 'C', 'target': 'D', 'value': 8}
])

sankey = hv.Sankey((links, nodes)).opts(
    hv.opts.Sankey(
        node_color='black',   
        node_line_color='red',  
        edge_color='purple',
    )
)

# Display the Sankey diagram
sankey

I would expect the nodes to be black!

I see there is an open issue here: Sankey node_color and node_fill_color options not applied · Issue #3835 · holoviz/holoviews · GitHub

Thanks @philippjfr for linking back here from the github issue.

I hope this issue can be resolved in the future, I think Sankey Diagrams are so cool but they really need the ability to set node colors!

In the meantime, I have found a work-around by setting node_line_width to be a large number like 20, since node_line_color is working as expected, this has the effect of coloring the node via making the edges super thick and coloring them.

I’m using the following to display a Sankey diagram flowing over time:


import hvplot.pandas
import holoviews as hv
import pandas as pd
import numpy as np
import panel as pn

hv.extension('bokeh')
pn.extension()

# Parameters
num_time_steps = 200

# Data setup
nodes = [
'A', 'B', 'C', 'D', 'E',
]

flows = [
    {'time': 1, 'source': 'A', 'target': 'B', 'value': 1e6},
    {'time': 1, 'source': 'A', 'target': 'C', 'value': 9e6},
    {'time': 2, 'source': 'B', 'target': 'D', 'value': 1e6},
    # {'time': 2, 'source': 'C', 'target': 'E', 'value': 1e6},
]

df = pd.DataFrame(flows)

# Add cumulative value
df['cumulative_value'] = df.groupby(['source', 'target'])['value'].cumsum()

# Extract unique nodes from source and target (sorted)
nodes_sorted = pd.unique(df[['source', 'target']].values.ravel('K'))
nodes_sorted = np.sort(nodes_sorted)  # Sort alphabetically

# Define the color mapping for the sorted nodes
from bokeh.palettes import Category20
palette = Category20[len(nodes_sorted)] if len(nodes_sorted) <= 20 else hv.Cycle('Category20').values
color_mapping = dict(zip(nodes_sorted, palette))
# Function to create Sankey diagram for a given time step
def create_sankey(t):
    subset = df[df['time'] <= t]
    sankey = hv.Sankey(subset, kdims=['source', 'target'], vdims='cumulative_value').opts(
        title=f'Cumulative Flows at Time {t}',
        label_position='right',
        width=1000,
        height=600,
        node_line_color=hv.dim('index').categorize(color_mapping, default='grey'),
        node_line_width=20,
        edge_color=hv.dim('source').categorize(color_mapping, default='grey'),
    )
    return sankey

# Create a player widget using Panel
time_steps = df['time'].unique()
player = pn.widgets.Player(
    name='Time', 
    start=time_steps.min(), 
    end=time_steps.max(), 
    step=1, 
    value=time_steps.min(), 
    width=800,
    interval=1000,
)

# Bind the function to the player widget
sankey_pane = pn.bind(create_sankey, t=player)

# Create a Panel layout
layout = pn.Column(sankey_pane, player)

# Display the layout
layout

I just posted a PR with minimal internal code changes to fix this fix: handle 'node_color' in element transformations for Bokeh and MPL by epaaso · Pull Request #6678 · holoviz/holoviews · GitHub.
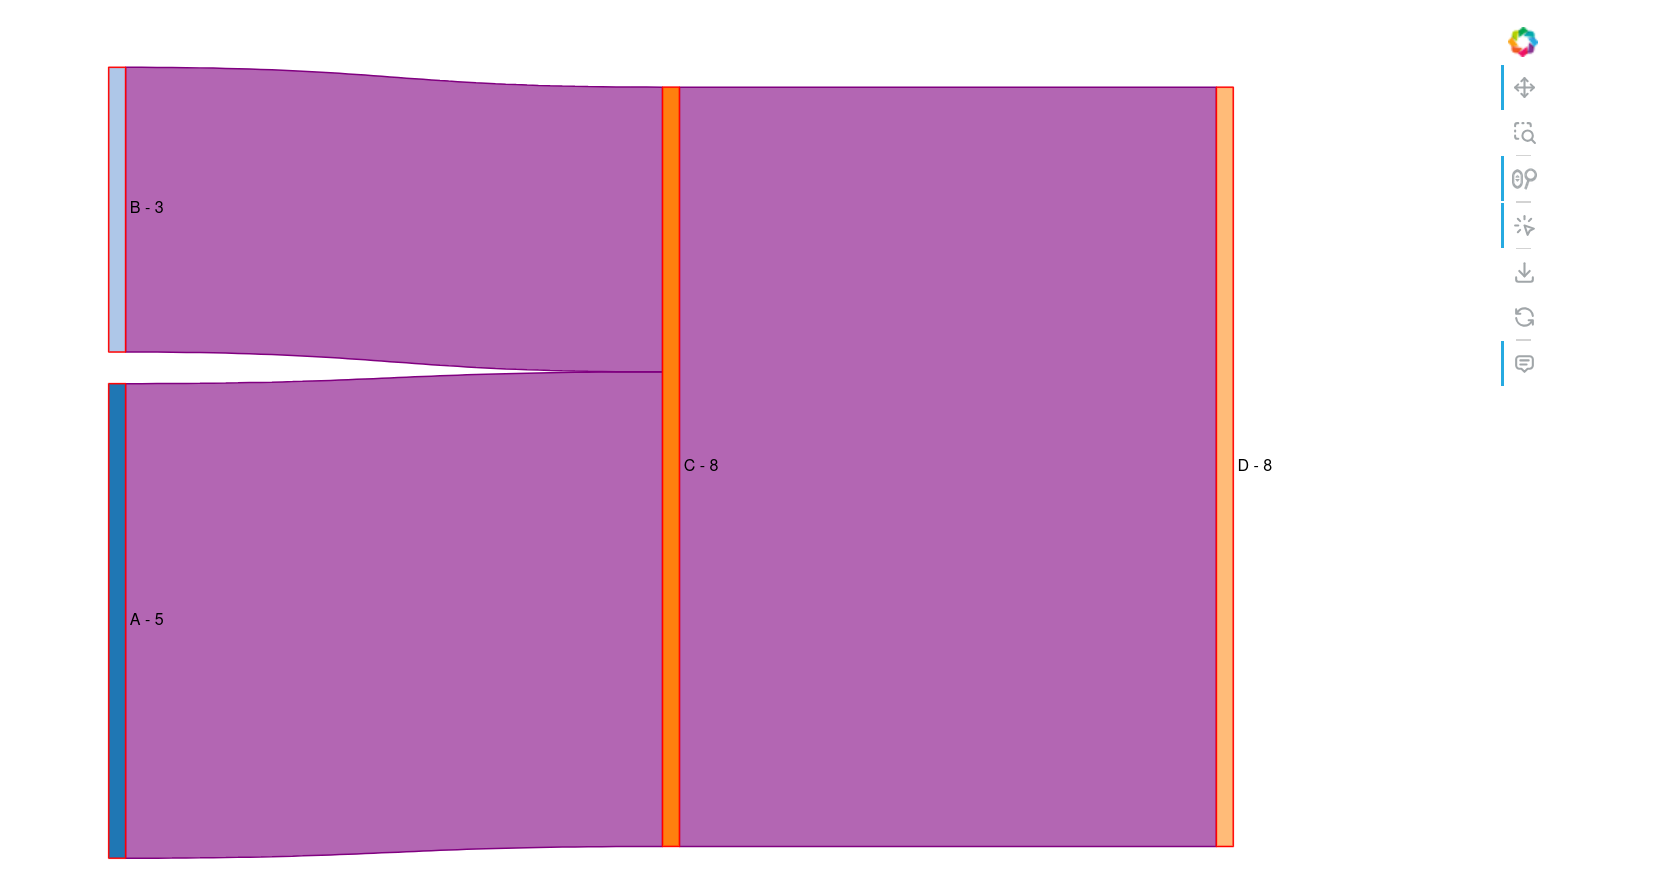
With this fix, if you define a Dataset instead of a dataframe for the nodes and use node_fill_color instead of node_color in bokeh, you can get a correct color assignment of the nodes.

Here is a minimal script that correctly assigns color to the nodes:

import pandas as pd
import holoviews as hv

# --- Choose backend ('matplotlib' or 'bokeh') ---
# hv.extension('matplotlib')  
hv.extension('bokeh')

# --- Category palette (>=9 categories) ---
# Using distinct colors (Tableau/ColorBrewer inspired) for clarity
palette = {
    'A': '#1f77b4',  # blue
    'B': '#ff7f0e',  # orange
    'C': '#2ca02c',  # green
    'D': '#d62728',  # red
    'E': '#9467bd',  # purple
    'F': '#8c564b',  # brown
    'G': '#e377c2',  # pink
    'H': '#7f7f7f',  # gray
    'I': '#17becf',  # cyan
}

# --- Build minimal links (already aggregated) ---
# Pattern: sources suffixed with (A), targets with (B) to mimic prior pattern
# We'll create a chain A->B->C->... plus a few cross links.
chain_letters = list(palette.keys())
links = []
for i in range(len(chain_letters) - 1):
    s = chain_letters[i]
    t = chain_letters[i+1]
    links.append({
        'source': f'{s} (A)',
        'target': f'{t} (B)',
        'value': 5 + i,  # simple increasing values
        'color': palette[s]  # color taken from source category
    })

# Add a few cross links to make it more interesting
cross_specs = [
    ('A', 'D', 2),
    ('B', 'E', 3),
    ('C', 'G', 1),
    ('E', 'I', 4),
    ('F', 'H', 2),
]
for s, t, v in cross_specs:
    links.append({
        'source': f'{s} (A)',
        'target': f'{t} (B)',
        'value': v,
        'color': palette[s]
    })

links_df = pd.DataFrame(links)

# --- Derive nodes_df from link endpoints ---
labels = pd.unique(pd.concat([links_df.source, links_df.target]))
nodes_df = pd.DataFrame(
    {
        'color': [palette[l.split(' (', 1)[0]] for l in labels],
        'label': labels
    },
    index=labels
)
nodes_df.index.name = 'index'

from holoviews import Dataset
nodes_ds = Dataset(nodes_df, kdims=['label'], vdims=['color'])

# --- Construct Sankey ---
sk = hv.Sankey((links_df, nodes_ds), kdims=['source', 'target'], vdims=['value', 'color'])

if hv.Store.current_backend == 'bokeh':
    sk = sk.opts(
        title='Minimal Sankey (bokeh)',
        labels='label',
        edge_color='color',
        node_fill_color='color',
        width=500, height=350,
        hooks=[label_hook()],
        bgcolor='white'
    )
else:  # matplotlib
    sk = sk.opts(
        title='Minimal Sankey (matplotlib)',
        labels='label',
        edge_color='color',      # constant or map; here field -> edges (length = edges)
        node_color='color',      # taken from node vdims (length = nodes)
        fig_inches=500/150,
        aspect=350/500,
        hooks=[label_hook()],
        bgcolor='white'
    )

# --- Display (in a notebook just evaluate `sk`) ---
if __name__ == '__main__':
    # If run as a script, export to static (matplotlib) or show (bokeh)
    if hv.Store.current_backend == 'matplotlib':
        hv.save(sk, 'sankey_minimal.png', fmt='png')
        print("Saved sankey_minimal.png")
    else:
        from bokeh.io import output_file, save
        hv.renderer('bokeh')
        output_file('sankey_minimal.html')
        save(hv.render(sk))
        print("Saved sankey_minimal.html")