Hi, I am trying to make scatter plot for large data with holoviews.operation.datashader.rasterize and show the hover. But I find one dimension of the data is missed on the hover after I use the rasterize. Here is the minimal example code:
import numpy as np
import datashader
import geoviews as gv
gv.extension('bokeh')
from holoviews.operation.datashader import rasterize

lon = np.array([8.75,8.76,8.77])
lat = np.array([46.1,46.2,46.3])
height = np.array([0.0,0.1,0.2])
index = np.array([0,1,2])

points = gv.Points(np.stack((lon,lat,height,index),axis=-1),
                   kdims=['Longitude','Latitude'],vdims=['Height','Index'])
points.opts(tools=['hover'])
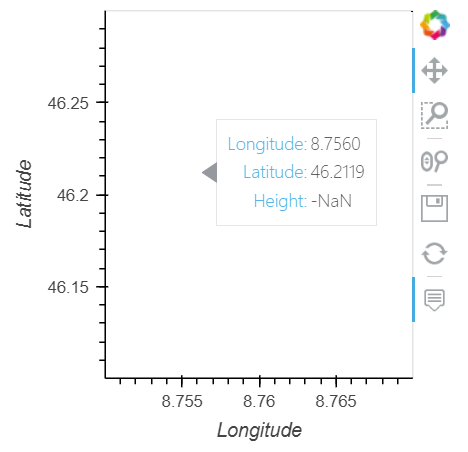
The result looks perfect, Longitude, Latitude, Height and Index are all showed. (sorry I can only upload one image as a new user on this website. So, I upload the most important one.)
The I rasterize it:
points = rasterize(points,aggregator=datashader.mean('Height'),vdim_prefix='',precompute=True)
points.opts(tools=['hover'])
The Index dimension is missing on the hover.
Then I try to print the rasterized points:
print(points)
and get:
:DynamicMap   []
   :Image   [Longitude,Latitude]   (Height)
It looks like the fourth dimension is missed. I have searched the overall manual but didn’t find anything related to it. Please let me know if anybody knows how to preserve this Index dimension and show it on the hover. Thanks a lot!