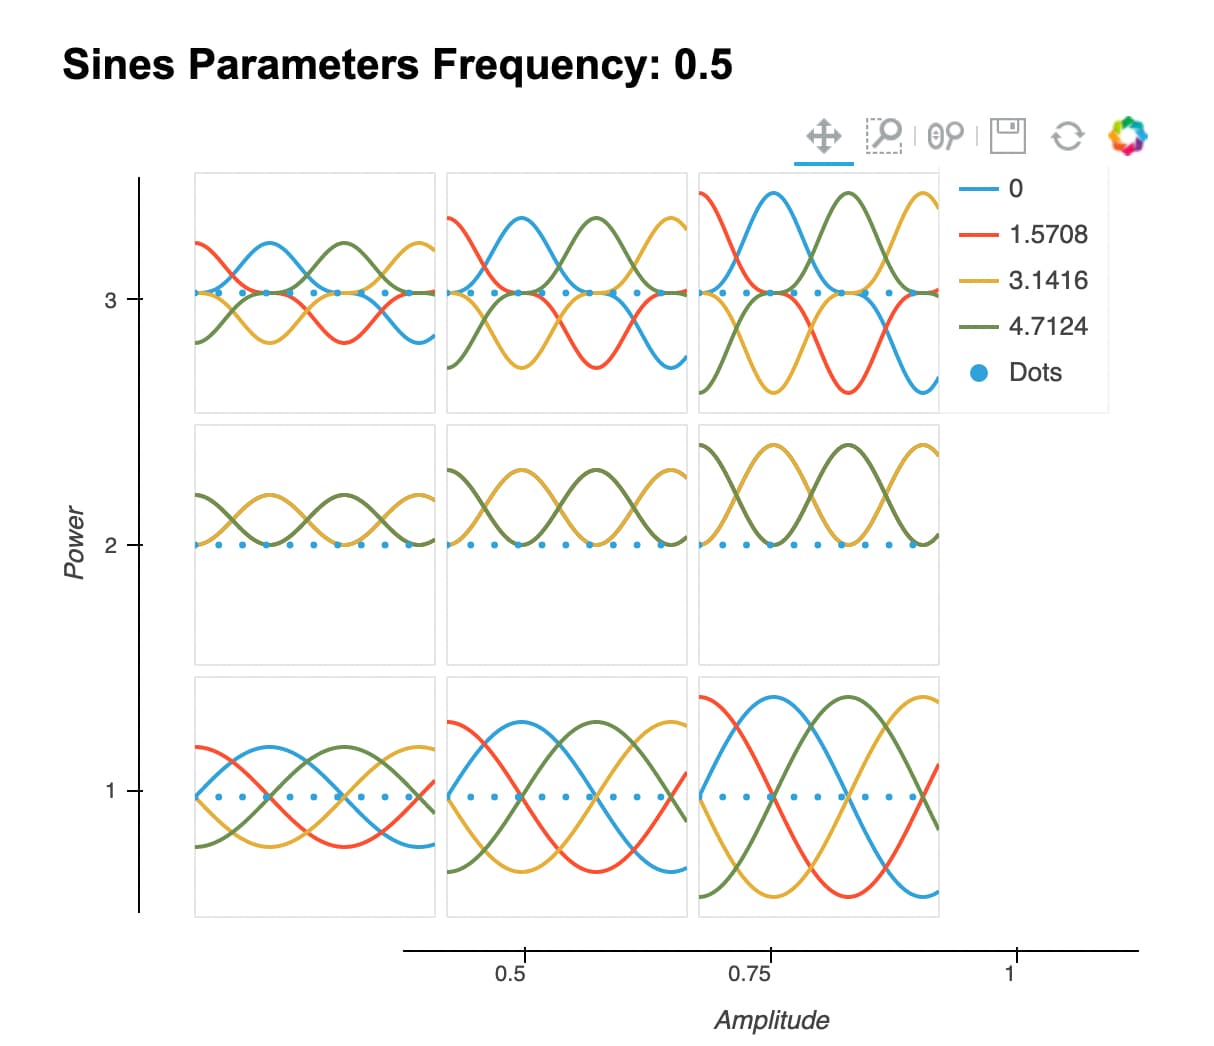
Hey @WolframStrauss , if you can use HoloViews’ GridSpace container, show_legend results in a single legend.
Here is adapted code from the docs.
import numpy as np
import holoviews as hv
hv.extension('bokeh')
np.random.seed(10)

def sine_curve(phase, freq, amp, power, samples=102):
    xvals = [0.1* i for i in range(samples)]
    return [(x, amp*np.sin(phase+freq*x)**power) for x in xvals]

phases =      [0, np.pi/2, np.pi, 3*np.pi/2]
powers =      [1,2,3]
amplitudes =  [0.5,0.75, 1.0]
frequencies = [0.5, 0.75, 1.0, 1.25, 1.5, 1.75]


gridspace = hv.GridSpace(kdims=['Amplitude', 'Power'], group='Parameters', label='Sines')

for power in powers:
    for amplitude in amplitudes:
        holomap = hv.HoloMap(kdims='Frequency')
        for frequency in frequencies:
            sines = {phase : hv.Curve(sine_curve(phase, frequency, amplitude, power))
                     for phase in phases}
            ndoverlay = hv.NdOverlay(sines, kdims='Phase').relabel(group='Phases',
                                                                   label='Sines', depth=1)
            overlay = ndoverlay * hv.Points([(i,0) for i in range(0,10)], group='Markers', label='Dots')
            holomap[frequency] = overlay
        gridspace[amplitude, power] = holomap

gridspace.opts(show_legend=True)
Although, as you can see, there is currently a bug that adding a legend misaligns the x-axis.
EDIT: I filed a bug report about the x-axis misalignment here