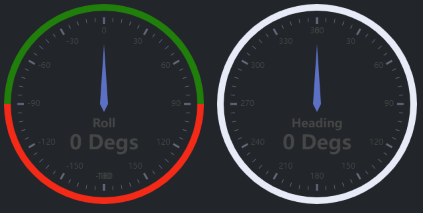
You might also create a custom JSComponent for echarts
import panel as pn
import param
from panel.custom import JSComponent
# Make sure Panel has the needed dependencies
pn.extension()
# Create a custom JSComponent for ECharts Gauges
class EChartsGauge(JSComponent):
"""Custom ECharts Gauge component using JSComponent."""
# Parameters
value = param.Number(default=0)
name = param.String(default="Gauge")
min_value = param.Number(default=0)
max_value = param.Number(default=100)
start_angle = param.Number(default=225)
end_angle = param.Number(default=-45)
format_string = param.String(default="{value}")
split_number = param.Integer(default=10)
colors = param.List(default=None)
hide_overlapping_labels = param.Boolean(default=False)
# External script dependencies
_importmap = {
"imports": {
"echarts": "https://cdn.jsdelivr.net/npm/echarts@5.4.3/dist/echarts.esm.min.js"
}
}
# JavaScript implementation
_esm = """
import * as echarts from 'echarts';
export function render({ model, el }) {
// Create container for the chart
const container = document.createElement('div');
container.style.width = '100%';
container.style.height = '100%';
el.appendChild(container);
// Initialize ECharts instance
const chart = echarts.init(container);
function updateChart() {
// Base configuration
const option = {
series: [{
"name": "Gauge",
"type": "gauge",
"axisTick": {"show": true},
"axisLabel": {"show": true},
"title": {"fontWeight": "bold", "fontSize": 18},
"splitLine": {"show": true},
"radius": "100%",
"detail": {"formatter": model.format_string},
"min": model.min_value,
"max": model.max_value,
"startAngle": model.start_angle,
"endAngle": model.end_angle,
"splitNumber": 12,
"data": [{"value": model.value, "name": model.name}],
"axisLine": {"lineStyle": {"width": 10}},
"labelLayout": {"hideOverlap": true},
"axisLabel": {hideOverlap: true}
}
]
};
// Add colors if provided
if (model.colors && model.colors.length) {
option.series[0].axisLine = {
lineStyle: {
width: 10,
color: model.colors
}
};
}
option.series[0].axisLabel.formatter = function(value) {
return value === model.min_value ? '' : model.format_string.replace('{value}', value);
};
// Apply options to chart
chart.setOption(option);
}
// Initialize chart
updateChart();
// Handle value changes
model.on('value', () => {
chart.setOption({
series: [{
data: [{
value: model.value
}]
}]
});
});
// Handle parameter changes that require full update
model.on(['min_value', 'max_value', 'start_angle', 'end_angle', 'split_number', 'colors', 'format_string', 'hide_overlapping_labels'], updateChart);
// Handle resize events
model.on('resize', () => {
chart.resize();
});
// Handle layout changes
model.on('after_layout', () => {
chart.resize();
});
return container;
}
"""
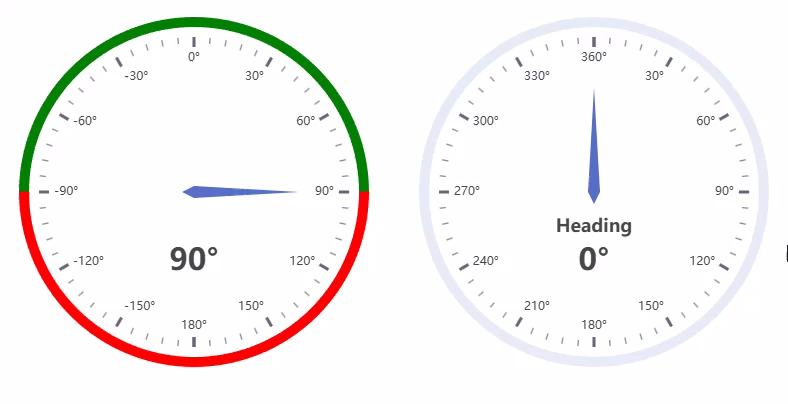
# Create the Roll gauge
roll_gauge = EChartsGauge(
name="",
value=90,
min_value=-180,
max_value=180,
start_angle=-90,
end_angle=270,
format_string="{value}°",
split_number=12,
colors=[(0.25, "red"), (0.75, "green"), (1, "red")],
height=350, width=350, margin=25
)
# Create the Heading gauge
heading_gauge = EChartsGauge(
name="Heading",
value=0,
min_value=0,
max_value=360,
start_angle=90,
end_angle=-270,
format_string="{value}°",
split_number=12,
hide_overlapping_labels=True,
height=350, width=350, margin=25
)
objs = pn.FlexBox(roll_gauge, heading_gauge, sizing_mode="stretch_width")
objs.servable()