Overlay curves by a categorical variable with just kdims and vdims?

I have a (stacked) dataframe that looks like the following:

test_df = pd.DataFrame({'x1':[1,2,1,2],'x2':['a','a','b','b'],'y':[1,2,2,3]})
	x1	x2	y
0	1	a	1
1	2	a	2
2	1	b	2
3	2	b	3

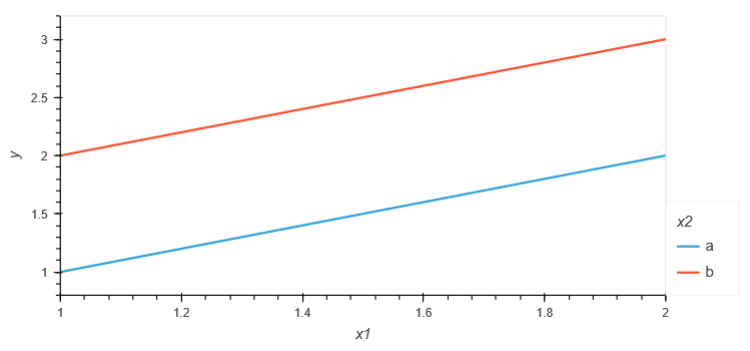
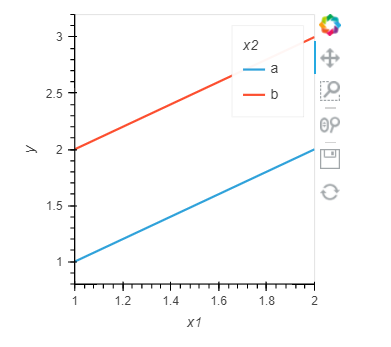
Is there a simple way to plot curves by individual categories with, e.g., just kdims and vdims?

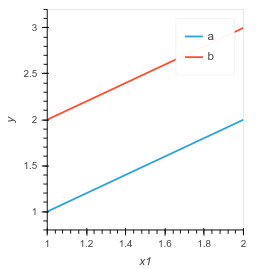
(hv.Curve(test_df[test_df['x2']=='a'], kdims='x1', vdims='y', label='a') * 
hv.Curve(test_df[test_df['x2']=='b'], kdims='x1', vdims='y', label='b'))

bokeh_plot (9)

I would properly use hvplot for this

import pandas as pd
import hvplot.pandas

test_df = pd.DataFrame({'x1':[1,2,1,2],'x2':['a','a','b','b'],'y':[1,2,2,3]})
test_df.hvplot(x="x1", y="y", by="x2")

1 Like

Another way if you don’t want to install/import hvplot:
hv.Dataset(test_df).to.curve("x1", "y", groupby="x2").overlay()
I think
image

1 Like

@ahuang11 @Hoxbro
I did not know either of the suggested solutions. Thank you!