Another way if you don’t want to install/import hvplot:
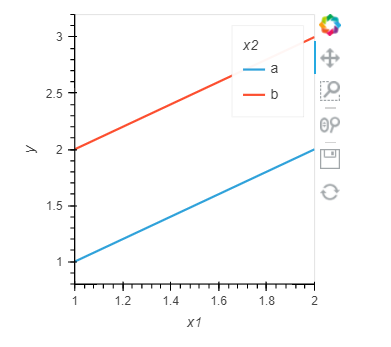
hv.Dataset(test_df).to.curve("x1", "y", groupby="x2").overlay()
I think
1 Like
Another way if you don’t want to install/import hvplot:
hv.Dataset(test_df).to.curve("x1", "y", groupby="x2").overlay()
I think