Overlay of Histogram and KDE

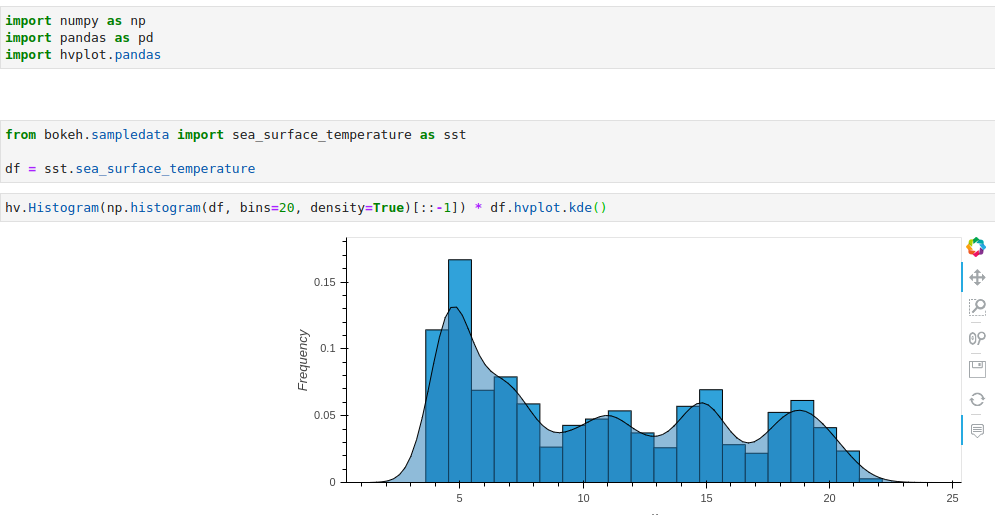
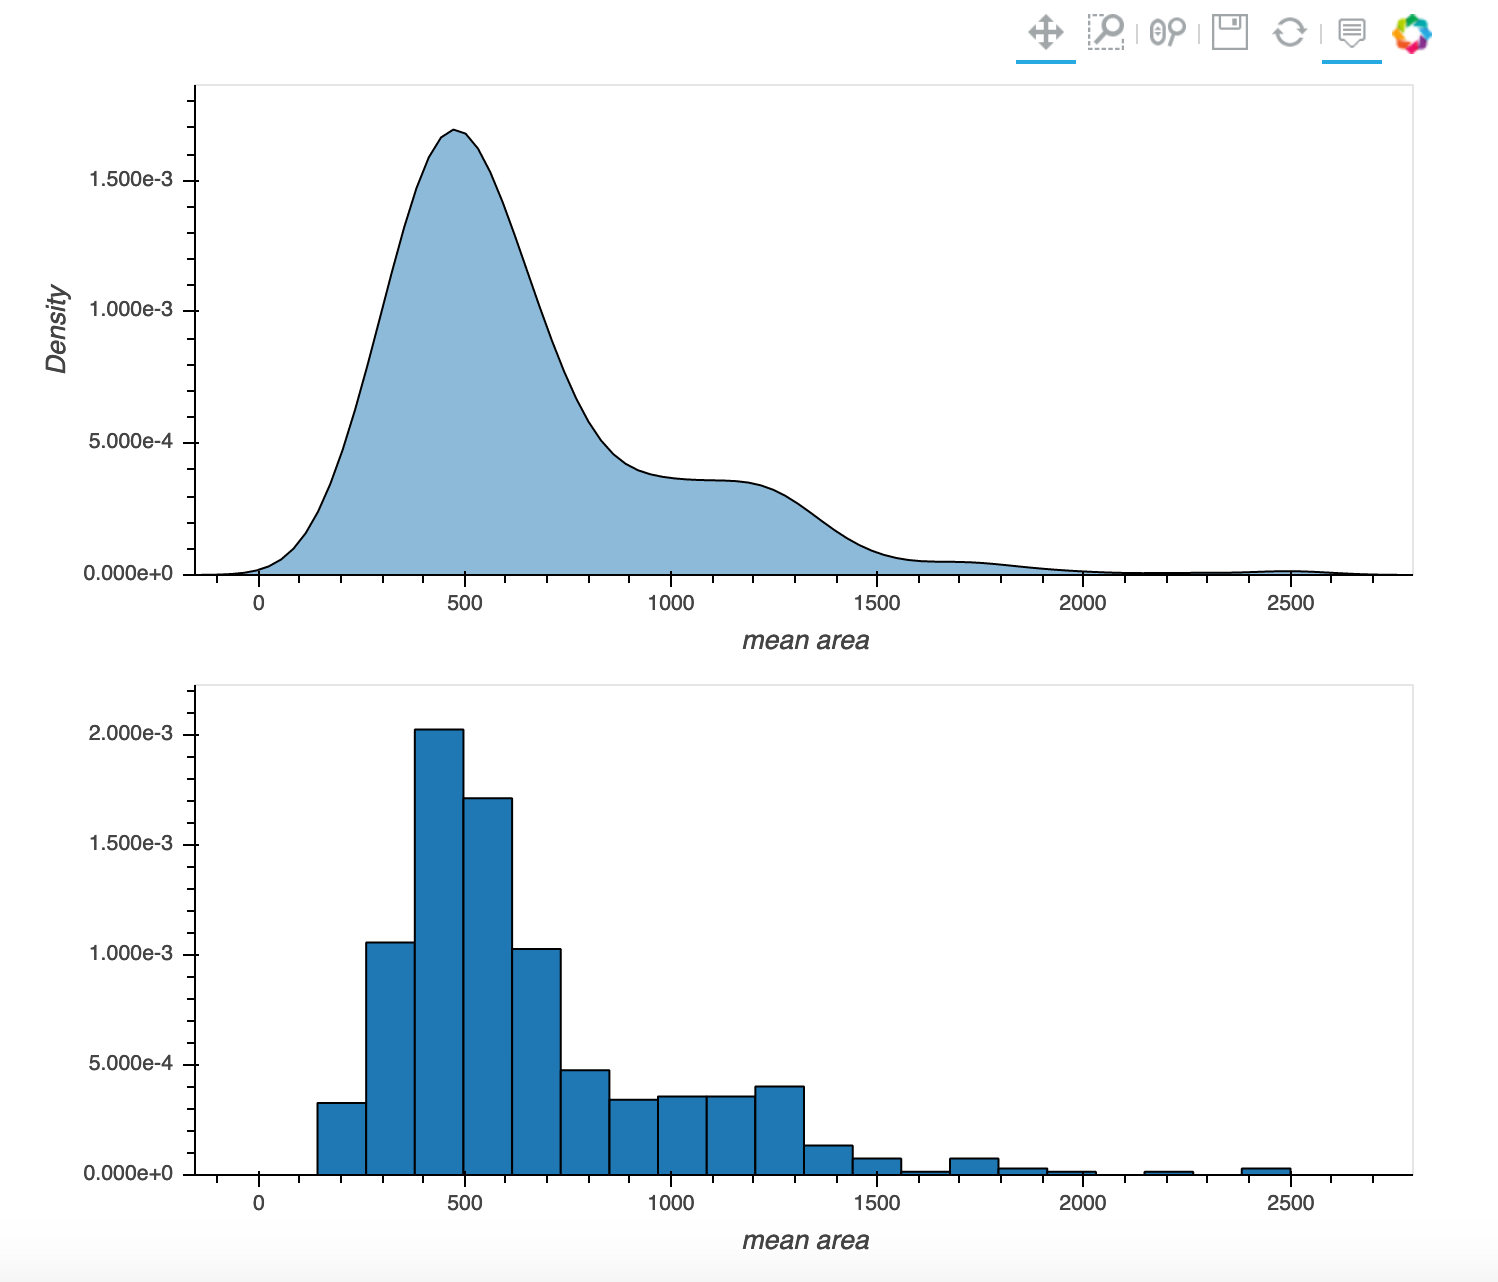
I can successfully create a layout of a histogram and a KDE:

In [12]: hist = df.hvplot.hist(y="mean area") 
    ...: density = df.hvplot.kde(y="mean area") 
    ...:  
    ...: result = density + hist 
    ...: result.cols(1)                                                                                                                                                                                                                                                   

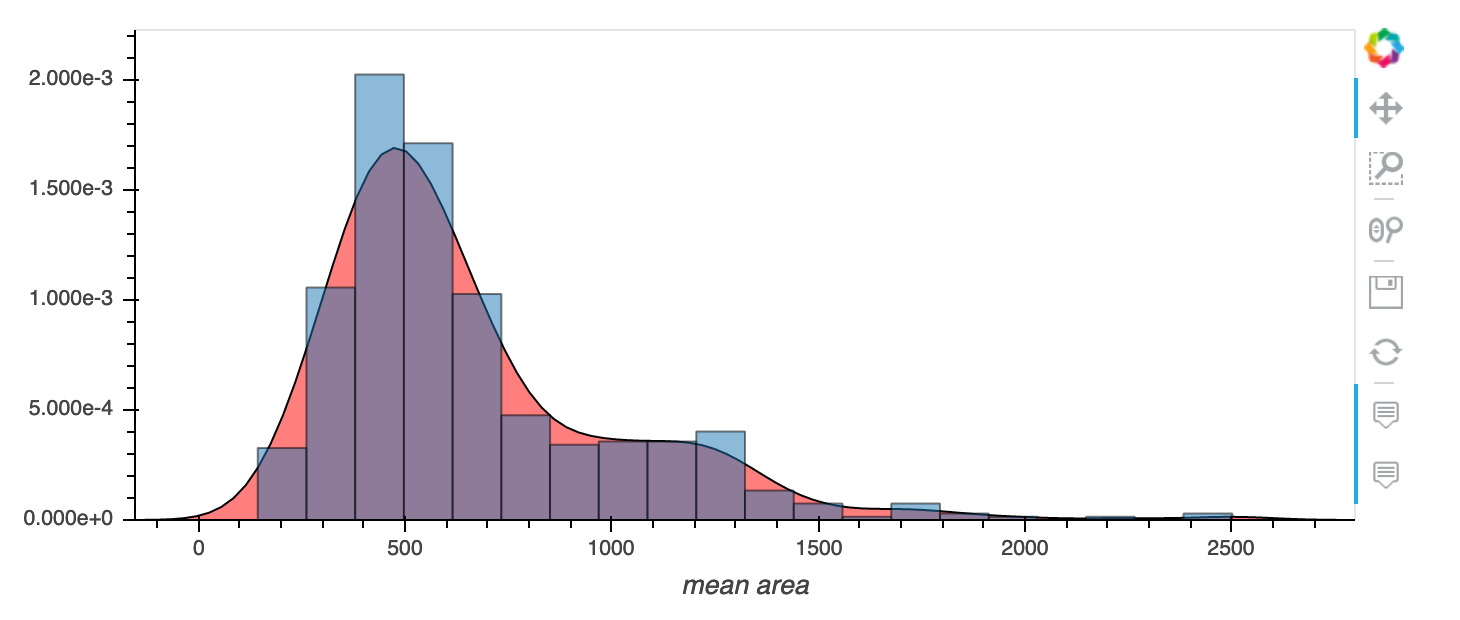
However, I can not create an overlay using the same plots:

In [13]: hist.opts(alpha=0.3) 
    ...: density.opts(color="red") 
    ...: result2 = density * hist 
    ...: result2   

As you can see, I can not see the KDE plot, even if I increase the alpha value to make it more transparent.

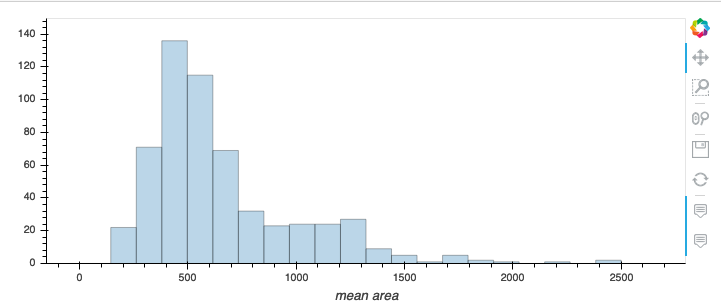
I can actually use an alpha value of zero for the histogram and I still can not see the KDE:

In [14]: hist.opts(alpha=0) 
    ...: density.opts(color="red") 
    ...: result2 = density * hist 
    ...: result2 

Does anyone have any idea what is happening here?

Thanks

Software Versions:

pandas                    1.0.3            py37h6c726b0_0 
numpy                     1.18.1           py37h7241aed_0  
holoviews                 1.13.1                     py_0    pyviz
hvplot                    0.5.2                      py_0    pyviz
feather-format            0.4.0                   py_1003    conda-forge
bokeh                     1.4.0                    py37_0
plotly                    4.5.4                      py_0    plotly

You have a problem with scales:
To plot both on the same graph you have to normalize your histogram by it’s integral.
however using hvplot I don’t know how to achieve it.
I can provide you an example using holoviews and numpy:


I haven’t found the density option in hvplot

I think you just need to pass normed=True to the .hist call.

My preference is to use hvplot, however many thanks for the alternative suggestion @xavArtley.

@philippjfr, Setting normed=True on my histogram correctly normalizes the scale for a layout:

However, for an overlay you musty instead use normalize=True or you get a ValueError.

Now my overlay successfully produces my desired plot:

Thanks for your help

Thank you for this. normed is not in the help method nor the online documentation of hvplot. In the end, Google had the answer.