My preference is to use hvplot, however many thanks for the alternative suggestion @xavArtley.
@philippjfr, Setting normed=True on my histogram correctly normalizes the scale for a layout:
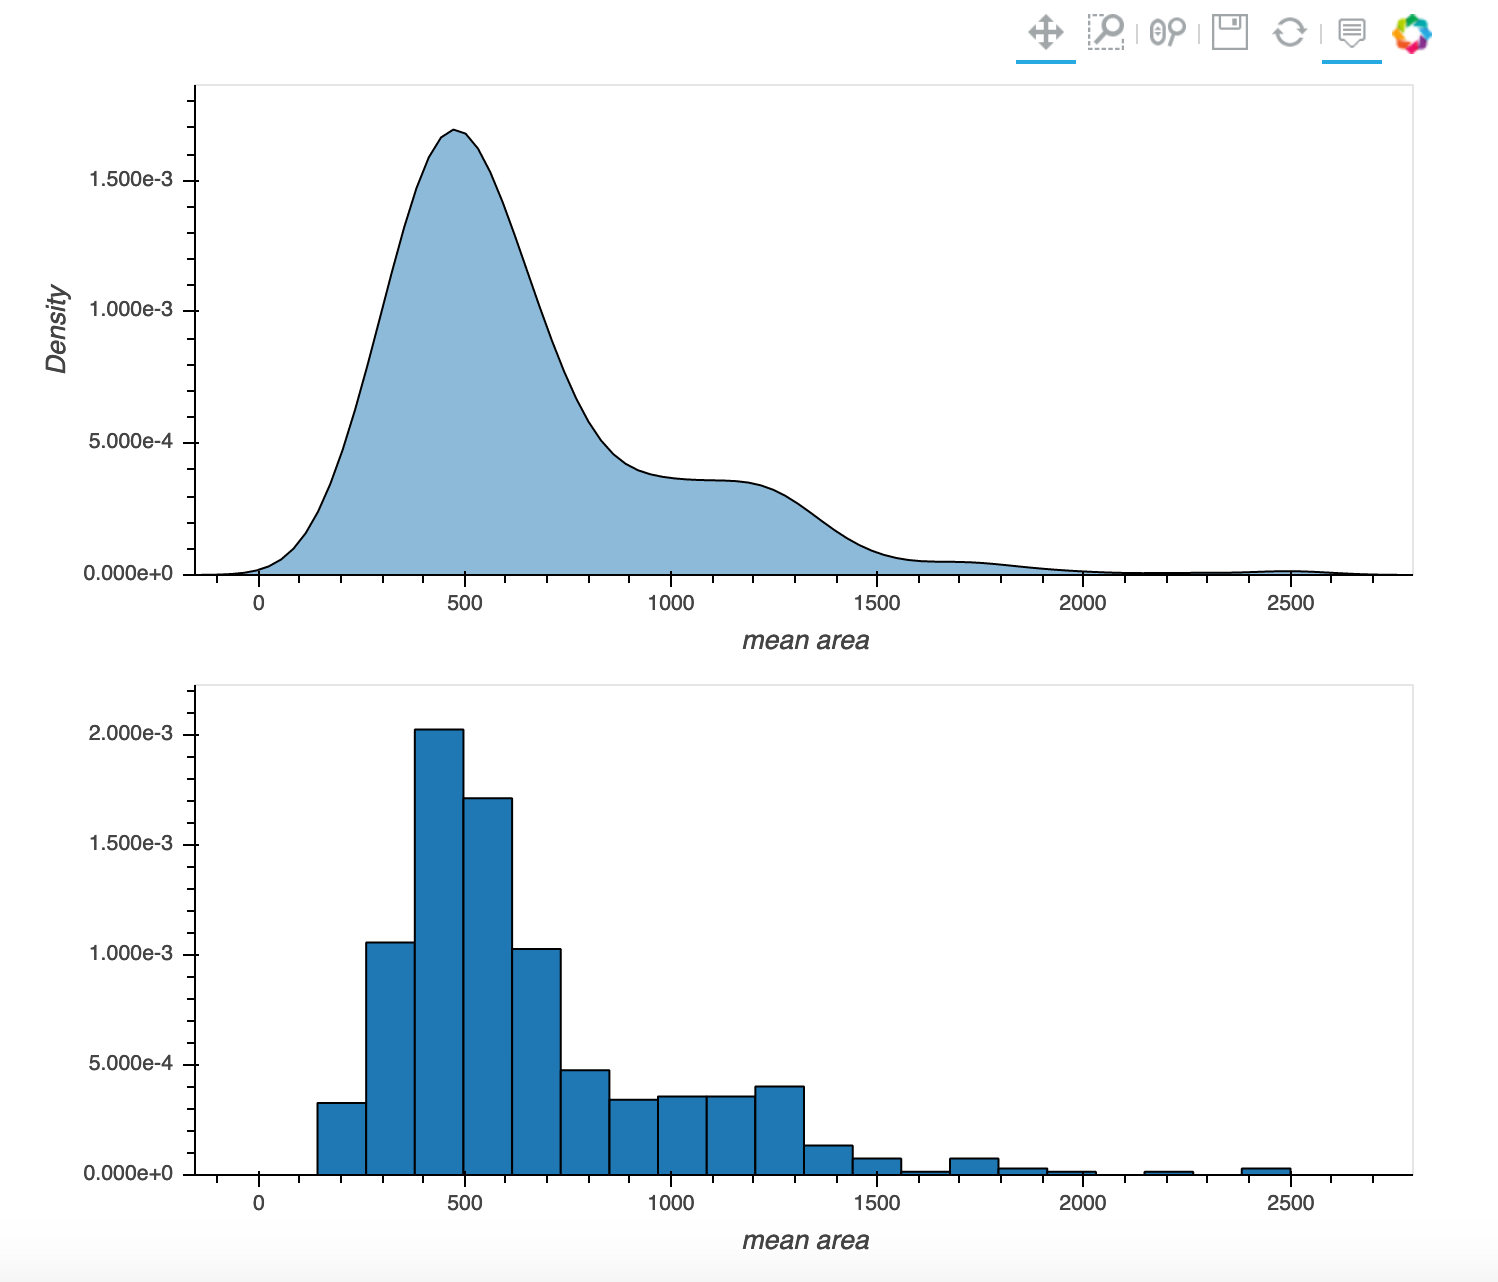
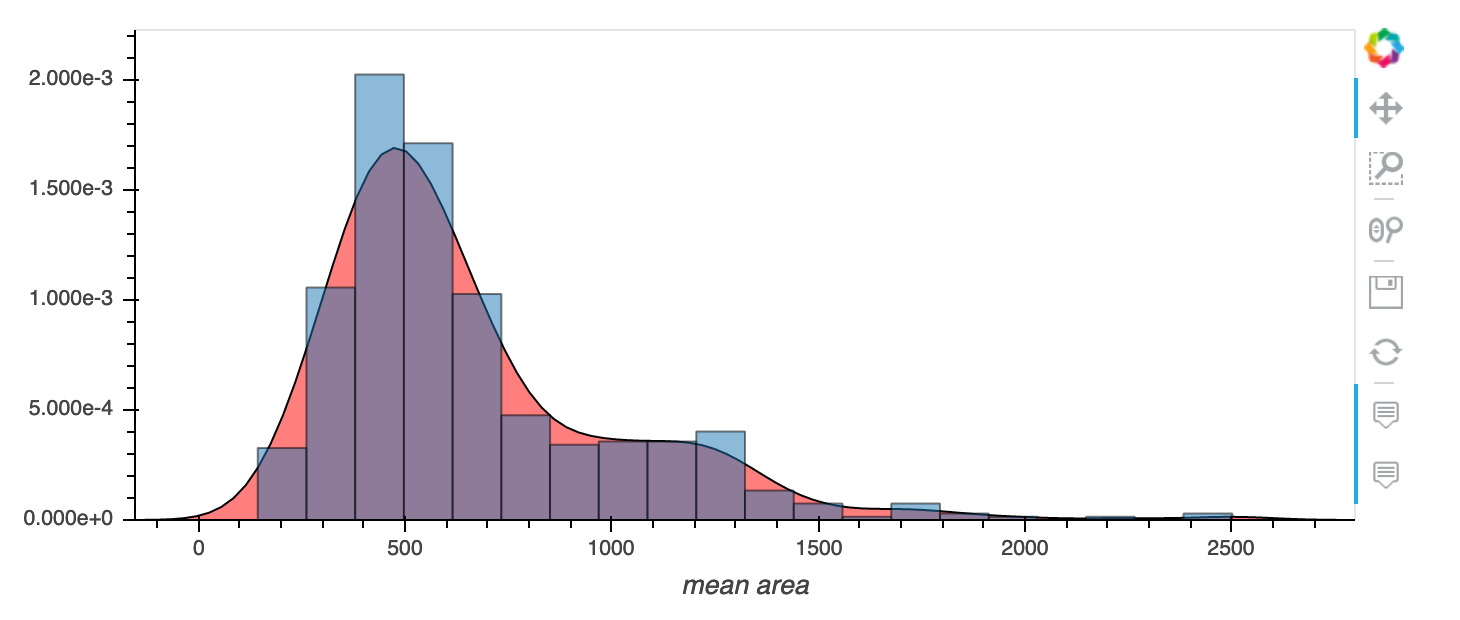
However, for an overlay you musty instead use normalize=True or you get a ValueError.
Now my overlay successfully produces my desired plot:
Thanks for your help