Hi. I am using hvplot with bokeh to overlay plots using " * ". Is there a way to add a legend to label each figure?
2 Likes
Hi, there are multiple ways to do that, you can :
Add a label to each plot.
import holoviews as hv
import pandas as pd
import hvplot.pandas
import numpy as np
df=pd.DataFrame(np.random.randint(0,100,50),columns=['val1'])
df2=pd.DataFrame(np.random.randint(0,100,50),columns=['val2'])
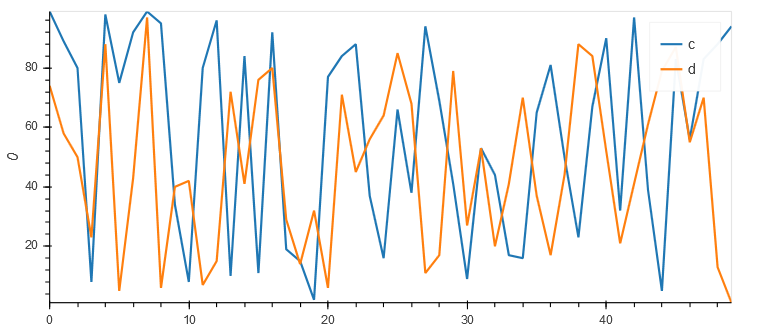
(df.hvplot(label='c')*df2.hvplot(label='d'))
Use Series instead of DataFrames
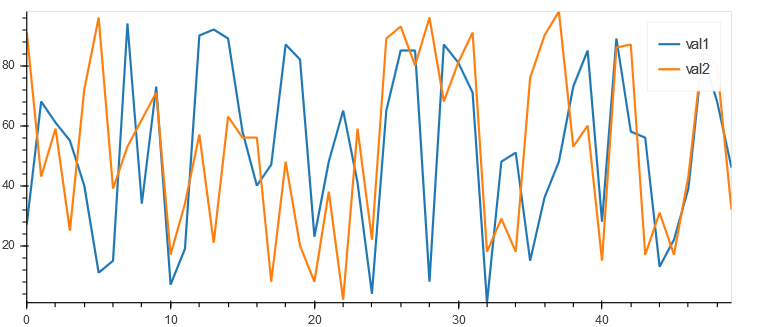
(df.val1.hvplot()*df2.val2.hvplot())
Use NdOverlay with a dictionary of plot
hv.NdOverlay({'a':df.hvplot(),'b':df2.hvplot()})

2 Likes