Thanks! The simplest answer to your question is that although you can’t overlay methods as you were attempting, you can easily make a HoloViews DynamicMap from a method, and DynamicMaps can be overlaid (see #3 below). But there are some other issues to clear up as well:
-
Normally, one won’t use Param’s “watch=True” mechanism on a method that returns a value. “watch=True” indicates that Param should re-run that method whenever the indicated parameter changes, and when Param runs it, it won’t have any idea what to do with the returned value; it will just disappear into the void. So if you use
watch=Trueon a method, the body of the method would need to have something that works by side effects, not by returning something. In this case,view_scattershouldn’t be markedwatch=True; there’s no reason Param should re-run that method and then throw away the value when the indicated parameter changes. -
Unlike Param, Panel Rows and Columns do know what to do with the output of
view_scatter, which is why you can pass theview_scattermethod object directly to a Panel Row or Column and see it update when its dependencies change. When given such a method object, Panel evaluates it once to have something to display, and then later re-evaluates it and re-displays the result whenever the dependent parameters change. Given that you want to return a value here, you also want to provide theview_scatterobject to Panel, not the evaluated resultview_scatter(). -
As you discovered,
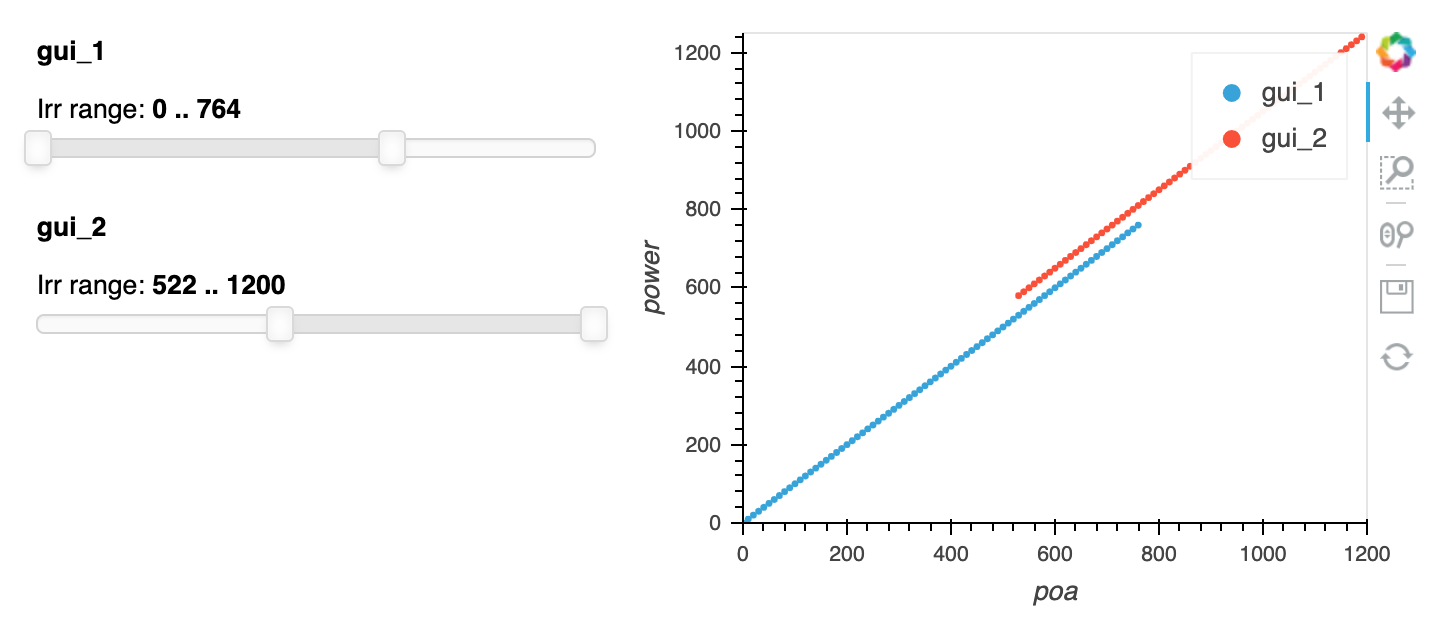
gui_1.view_scatter() * gui_2.view_scatter()successfully creates an overlay because the result of those calls is something overlayable (a HoloViews Element in both cases), but you can’t simply overlay a method on a method; Python methods don’t have any notion of “overlaying”. Panel also doesn’t provide any support for overlaying; it only knows how to lay things out alongside each other, not on top of each other. So how do you do it? Well, a HoloViews DynamicMap can dynamically construct anything you want, with any dependencies you need, so you could write a function that overlays the two objects and use that function as the callback for a DynamicMap that you display. However, in this case I think it would be tricky to write a single DynamicMap that would respect the dependencies declared in the separate classes used here. Luckily, individual HoloViews DynamicMaps can be overlaid on each other, so you can simply turn each of the methods into a DynamicMap and then overlay those. HoloViews will print a warning if you stop there, as it doesn’t want DynamicMaps nested inside of Overlay objects, but you call.collate()on the final result to turn it inside out with a single DynamicMap at the top level, as HoloViews expects things to be organized. I.e.:
overlay = hv.Overlay([hv.DynamicMap(gui_1.view_scatter), hv.DynamicMap(gui_2.view_scatter)]).collate()
pn.Row(pn.Column(gui_1.param, gui_2.param), overlay)
I think this achieves the result that you are looking for.
- As you suspected, I don’t think you need to have a Capdatagui class in the first place; it says that it is “wrapping the CapData class to add parameters”, but classes don’t become GUI classes just because they have Parameters (e.g. most of our code is Parameterized but only a few things are ever shown in a GUI). Normally one would just add Parameters to the class that actually uses the value of those parameters, i.e. CapData in this case. If you don’t control CapData (e.g. if it’s imported from somewhere else) then it can make sense to have a wrapper, but otherwise it’s much simpler to keep parameters tightly linked to the code that they will be controlling, i.e. in CapData in this case. We made sure Param had no external dependencies so that it would be simple to include Parameterized objects in any codebase, letting you prepare that code for GUI usage without ever committing to any particular GUI library.
The updated runnable example is below (though I didn’t merge CapData and Capdatagui since I wasn’t sure if that was appropriate for you).
import pandas as pd
import numpy as np
import holoviews as hv
import panel as pn
import param

hv.extension('bokeh')

class CapData(object):
    def __init__(self):
        super(CapData, self).__init__()
        self.df = pd.DataFrame()
        self.df_flt = None

    def filter_irradiance(self, low, high, column_name):
        flt_str = '@low <= ' + column_name + ' <= @high'
        ix = self.df.query(flt_str).index
        self.df_flt = self.df.loc[ix, :]

    def reset_flt(self):
        self.df_flt = self.df.copy()

    def scatter(self):
        return hv.Scatter(self.df_flt, 'poa', 'power').opts(width=400, xlim=(0, 1200), ylim=(0, 1250))

# create synthetic data
x = np.arange(0, 1200, 10)
y = x
y2 = x + 50

# create two instances of the CapData class using synthetic data
cd = CapData()
cd.df = pd.DataFrame({'poa':x, 'power':y})
cd.df_flt = cd.df.copy()

cd2 = CapData()
cd2.df = pd.DataFrame({'poa':x, 'power':y2})
cd2.df_flt = cd2.df.copy()

class CapdataGui(param.Parameterized):
    # class wrapping the CapData class to add parameters
    irr_range = param.Range(default=(0,1200), bounds=(0, 1200))

    def __init__(self, capdata, **param):
        super().__init__(**param)
        self.capdata = capdata

    @param.depends('irr_range', watch=True)
    def filter_irr(self):
        self.capdata.reset_flt()
        self.capdata.filter_irradiance(*self.irr_range, 'poa')

    @param.depends('irr_range')
    def view_scatter(self):
        scatter = self.capdata.scatter().relabel(self.name)
        return scatter

gui_1 = CapdataGui(cd,  name='gui_1')
gui_2 = CapdataGui(cd2, name='gui_2')

def olay(*args):
    widgets = pn.Column(*[a.param for a in args])
    overlay = hv.Overlay([hv.DynamicMap(a.view_scatter) for a in args]).collate()
    return pn.Row(widgets, overlay)

olay(gui_1, gui_2)