Hi ,
I have a dask dataframe with 10M rows. and columns as Name, Point (x,y), Polygon. Point(x,y) is the centroid of the polygon . I am struggling with plotting this in datashader. I am new to holoviz eco-system.
Ideally, I would like to plot polygon column with Name and save it as a basemap that i can use later to overlay it with other data. Can someone help or point me in the right direction ?
Unfortunately, I don’t think this will be straightforward.
nyc_buildings redirect shows an example of plotting a lot of polygons, so if you can convert your Polygon column (whatever type that is) into the format used there you should be able to plot the polygons.
Once you get that going, Datashader has some examples (at https://github.com/holoviz/datashader/blob/main/examples/tiling.ipynb and maybe elsewhere?) of generating tiles, so in principle you should be able to render those polygons at different resolutions and make a base map.
After that, is the idea that you want to plot each name at the centroid? If so Datashader doesn’t have any string rendering so you’d need to use HoloViews alone for that, but the Bokeh backend will struggle with 10M strings dumped into the browser for it to use, and I don’t know a way to render those strings into another base map to overlay onto the polygon tiles. Whoever created the StamenLabels base map knows how to do that, but I don’t know what tools they used (and if they were even e.g. Python).
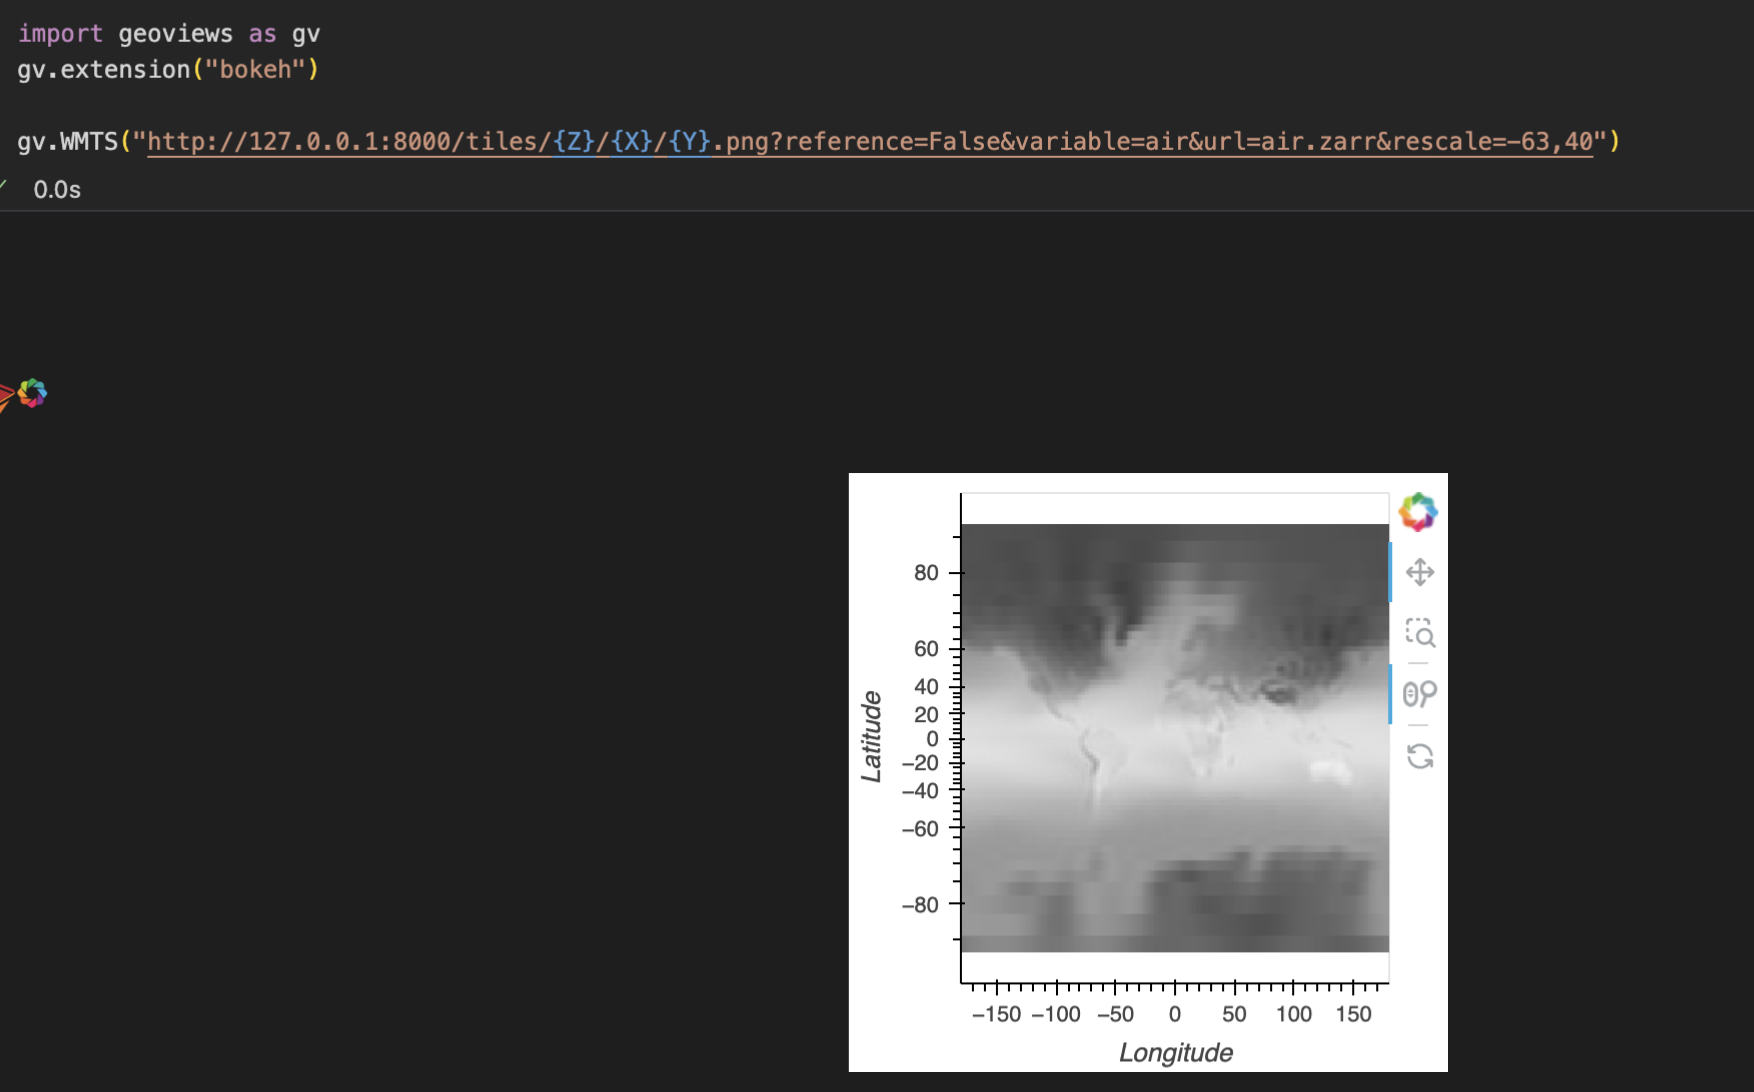
If you have an xarray dataset, you can build a basemap on the fly with titiler-xarray.
I am not sure if there’s an equivalent for geopandas.
There’s also GDAL2Tiles which you can use gv.WMTS to point to the directory, but I’m not sure if it works with shapefiles. gdal2tiles.py — GDAL documentation
Thanks @jbednar
I have the following code working for me. Is it possible to generate hover to show Name .
type(ddfC)
Dask DataFrame Structure:
| | inst | ref | cx | cy | geometry |
polys = hv.Polygons(ddfC)
polys.opts(width=891, height=1344, xlabel=‘x’, ylabel=‘y’, line_width=1, tools=[‘hover’, ‘tap’] )
polys
I am able to see the plot. But when I hover over the polygon, i dont see anything.
Assuming inst is the name you want to show, you can add hover_cols=["inst"] as described at Customization — hvPlot 0.8.5a1 documentation .