Hi, there is some overplotting when I plot overlay images. Below is my code snippet:
import echopype as ep
import holoviews
import panel
import param
import xarray
holoviews.extension("bokeh")

MVBS_ds = xarray.open_mfdataset(
    paths = 'concatenated_MVBS.nc',
    data_vars = 'minimal', coords='minimal',
    combine = 'by_coords'
)

gram_opts1={'Image': {
            'cmap':'Reds',
            'tools': ["box_select", "lasso_select", "hover"],
            'invert_yaxis': False,
            'width': 600,
            'alpha':0.8}
        }

gram_opts2={'Image': {
            'cmap':'Greens',
            'tools': ["box_select", "lasso_select", "hover"],
            'invert_yaxis': False,
            'width': 600,
            'alpha':0.8}
        }

gram_opts3={'Image': {
            'cmap':'Blues',
            'tools': ["box_select", "lasso_select", "hover"],
            'invert_yaxis': False,
            'width': 600,
            'alpha':0.8}
        }

tabs = panel.Tabs()

plot1=holoviews.Dataset(MVBS_ds.sel(channel='GPT  18 kHz 009072058c8d 1-1 ES18-11')).to(holoviews.Image,
                                vdims=["Sv"],
                                kdims=["ping_time","echo_range"]
                                ).opts(gram_opts1)

plot2=holoviews.Dataset(MVBS_ds.sel(channel='GPT  38 kHz 009072058146 2-1 ES38B')).to(holoviews.Image,
                                vdims=["Sv"],
                                kdims=["ping_time","echo_range"]
                                ).opts(gram_opts2)

plot3=holoviews.Dataset(MVBS_ds.sel(channel='GPT 120 kHz 00907205a6d0 4-1 ES120-7C')).to(holoviews.Image,
                                vdims=["Sv"],
                                kdims=["ping_time","echo_range"]
                                ).opts(gram_opts3)

tabs.append(("channels", (plot1*plot2*plot3)))

tabs
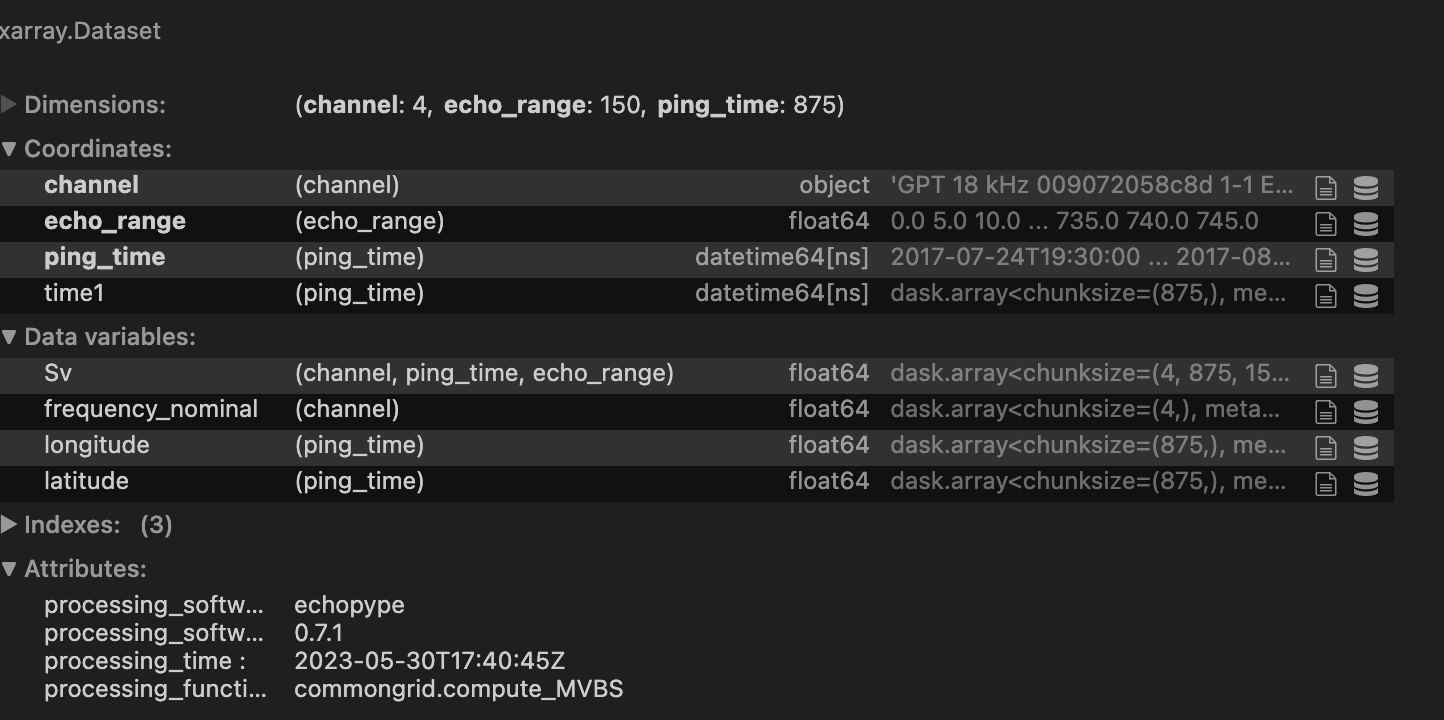
My data is xarray format:
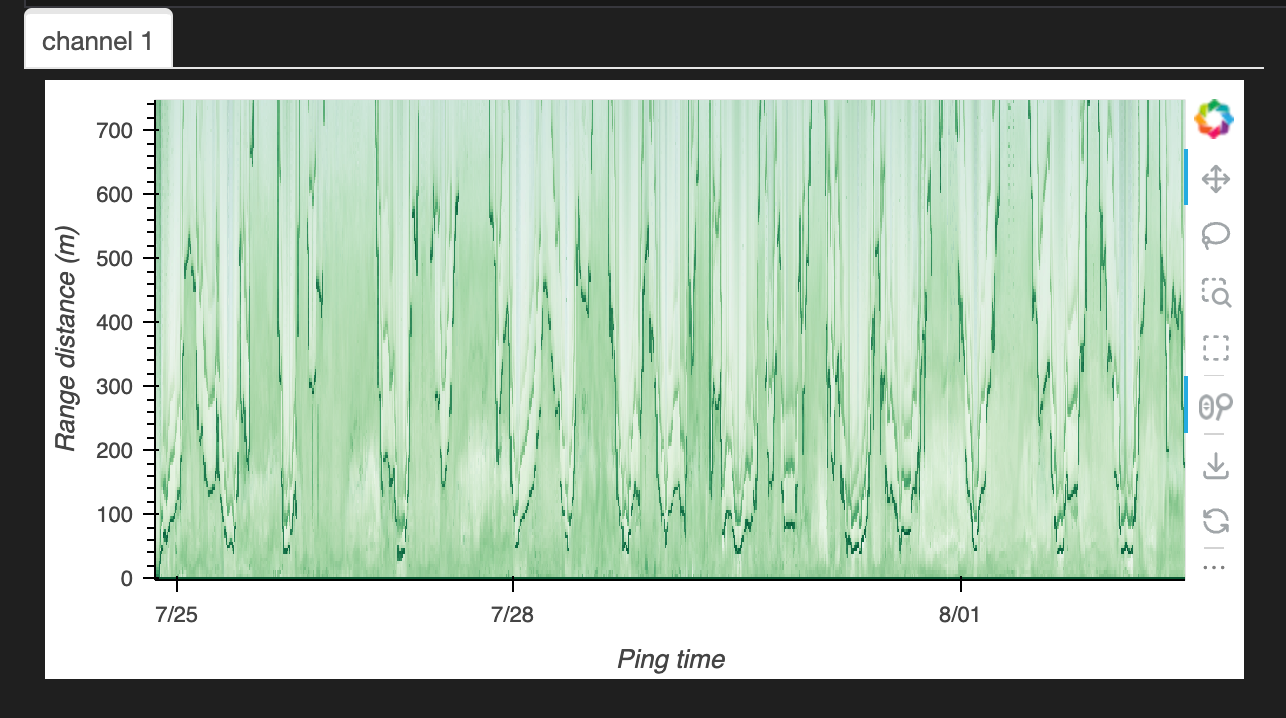
When plotting (plot1*plot2*plot3)
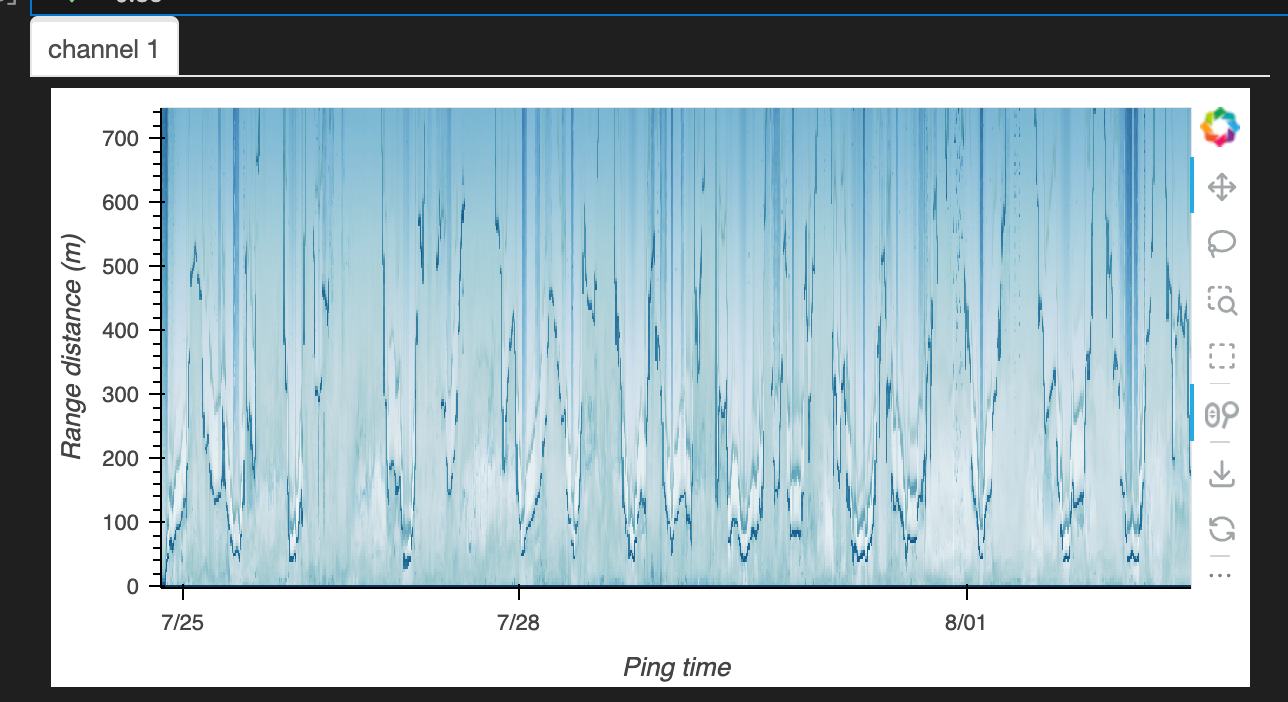
When plotting (plot1*plot3*plot2)
How can I plot without overplotting (mix the color of three layout pixels)? Thanks~