Panel 0.13.0 Release Candidate

Hi everyone!

It’s been a really long time since we had a major (or rather minor release if you believe in SemVer). However it is now almost time again and I have just tagged Panel 0.13.0 RC1. This is a release candidate so there should be no major changes between this dev release and the final release. However now is the time for you to help us out and test your application to ensure it will still work after the update.

To get the RC install it with pip install "panel==0.13.0rc1" or conda install -c pyviz/label/dev "panel=0.13.0rc1"

We aim to release later this week, so now is your chance.

5 Likes

Interactivity + hover info with plotly doesnt work as expected within tabs
(starting from version 0.12.5… on 0.12.4 it works fine)

Video:
https://drive.google.com/file/d/1uYxRM8l49pjdIfntSIx695-ZiH10Zt_K/view?usp=sharing

Reproducible Code:
#panel==0.13.0rc1,plotly==5.6.0, param==1.12.1

import plotly.express as px
import panel as pn
import pandas as pd
import numpy as np
pn.extension(“plotly”)

df = pd.DataFrame(np.random.randint(
[1, 600], [4, 1000], size=(100, 2)), columns=[‘group’, ‘values’])
option1 = pn.Column(
“Boxplot inside nested tabs:”,
pn.Tabs(
pn.Tabs((“Tab1.1”, px.box(df, x=‘group’, y=‘values’)),
(“Tab1.2”, px.box(df, x=‘group’, y=‘values’))),
pn.Tabs((“Tab2.1”, px.box(df, x=‘group’, y=‘values’)),
(“Tab2.2”, px.box(df, x=‘group’, y=‘values’)))
),
)
option2 = pn.Column(
“Boxplot inside tabs:”,
pn.Tabs(
(“Tab1.1”, px.box(df, x=‘group’, y=‘values’)),
(“Tab1.2”, px.box(df, x=‘group’, y=‘values’)),
(“Tab2.1”, px.box(df, x=‘group’, y=‘values’)),
(“Tab2.2”, px.box(df, x=‘group’, y=‘values’))
),
)
option3 = pn.Column(px.box(df, x=‘group’, y=‘values’))
pn.Column(option1, option2, option3).show()

2 Likes

I am testing this Patching values in Tabulator causes the vertical scrollbar to reset · Issue #3249 · holoviz/panel · GitHub with the 0.13.0rc1 and the problem seems to be still there

My custom template/theme stopped working, probably because of Add ComponentResourceHandler to server by philippjfr · Pull Request #3284 · holoviz/panel · GitHub ?

But I guess now it should be easier to use custom templates.
My initial run i got only a header, I’m getting there though: :sweat_smile:

More parts are showing up now

Can you give me instructions on how to run that?

I’ve tagged 0.13.0 RC2 now including a fix for the tab issue and some updates to component libraries (Vega and perspective).

There are develop install instructions here: Installation — PyHDX v0.4.0b8+25.gd949888.dirty documentation

I don’t think what I’ve done template wise should run but if you could take a look and point me in a direction to get it working again that would be great.

In pyhdx/web/template.py is my ExtendedGoldenTemplate which overrides _template_resources where, if i remember correctly, I point to the css/js files bundled with pyhdx.

And on top of that I overload _template with something like this:

class ReadString(str):
    """
    Extends the `string` class such that it can be used to monkey-patch the _template class attribute of GoldenTemplate
    """

    def read_text(self):
        return str(self)

template_code = ReadString(< html template >)
ExtendedGoldenTemplate._template = template_code

Which is in pyhdx.web.template.GoldenElvis.compose

1 Like

So there were two issues:

  1. The location of the bundled resources changed so it was looking in the wrong place.
  2. Your jinja template still had old code to specify the resources.

I’ve now pushed up Update resources for Panel 0.13.0 by philippjfr · Pull Request #264 · Jhsmit/PyHDX · GitHub which gets rid of all the resource handling code. That relies on Ensure resource handling recognizes pathlib objects by philippjfr · Pull Request #3324 · holoviz/panel · GitHub to be merged.

1 Like

Amazing thanks! Will merge when 0.13.0 is out

Thanks!!
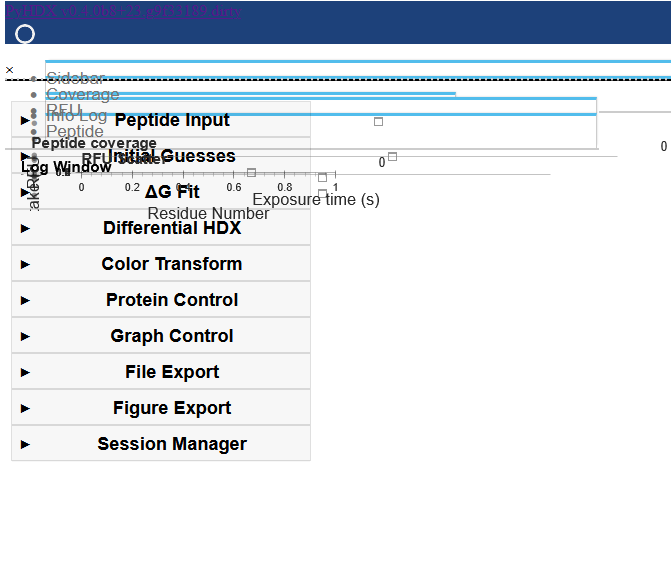
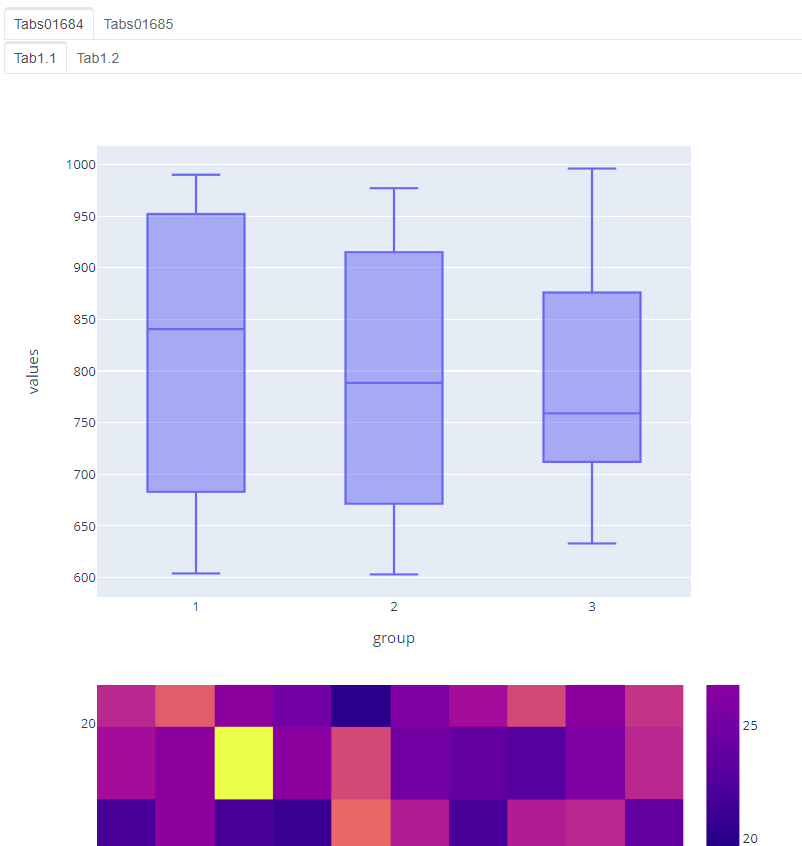
I still have some problems with plots overlaying other plots (from other tabs)
for example tab 1 has a plot with a height of 400 and tab 2 has another plot with a height of 800
so when i am on tab 1 i see the bottom of plot from tab 2 below the plot on tab 1
maybe you can also take a look and try to fix that.

@alon-sht Can you provide an example? I’ve never seen this.

At first i wasnt able to reproduce it but I found out that this happens when the plot is inside a pn.Column (in a tab)
see example below:

import plotly.express as px
import panel as pn
import pandas as pd
import numpy as np
pn.extension(‘plotly’)

df = pd.DataFrame(np.random.randint(
[1, 600], [4, 1000], size=(100, 2)), columns=[‘group’, ‘values’])

df2 = pd.DataFrame(np.random.randint(
1, 100, size=(100, 30)))

plt = pn.Column(px.box(df, x=‘group’, y=‘values’, height=550))
plt3 = pn.Column(px.density_heatmap(df2, height=800))
option1 = pn.Column('Boxplot inside nested tabs: ',
pn.Tabs(
pn.Tabs((‘Tab1.1’, plt),
(‘Tab1.2’, plt3)),
pn.Tabs((‘Tab2.1’, plt),
(‘Tab2.2’, plt))
),
)

pn.Column(option1 ).show()

This is what i see:

Thanks @alon-sht. It seems somehow it’s overriding the visibility=hidden setting on the parent div. I can push a fix that also sets opacity: 0 for the element, which seems to work.

Thanks, will you push it to 0.13.0 RC3? I would like to keep on testing :slight_smile:

Yes, I’ll tag RC3 in the next hour.

Took a little longer but RC3 is building Bump panel.js version · holoviz/panel@bc4ff4f · GitHub

1 Like

Hi,
I just checked 0.13.0rc3 with my (unfortunately quite complex and somehow messy) panel application and in some cases (file upload, expensive background calculation) the bootstrap template busy indicator is not working anymore. (the one in the upper right, <div class="pn-busy-container">)
In some cases (for example making a selection from a plotly plot) it still works.
It used to work perfectly with panel version 0.12.4.
I will dig more into it and try to find out, what´s the “specialty” about the cases where it is/isn´t working or if I can reproduce the error in a minimal example. Until then I must admit I am not able to post something useful/runnable, sorry.
But I post this just in case you might immediately know what the problem/solution could be or if other users have the same problem.
Thanks!

Edit: RC4 fixed this, thank you, great stuff :slight_smile:

Thanks @ingebert. I’ve pushed a fix here and will release RC4 in the next couple of hours: Ensure bokeh events set busy indicator by philippjfr · Pull Request #3332 · holoviz/panel · GitHub

1 Like

I use azure for OAuth and the update to 0.13.0rc4 gives me this error:

image

Then I clear cookies and sign in again and I get the following error from chrome:

This page isn’t working

---------.com redirected you too many times.

ERR_TOO_MANY_REDIRECTS
and redirects me back to the error in the picture above.

When I downgrade back to 0.12.4 everything works as usual
Without Azure, everything works as expected as well.

Thanks for adding support for Altair/Vega events in this release, that’s very exciting! I noticed that the example in the docs does not work if I change the Altair selection from interval to a point selection (single or multi). These return an empty dictionary, whereas interval returns something like

{'Beak Length (mm)': [51.824, 53.952], 'Beak Depth (mm)': [18.796, 18.904]}

It would be great if point selections were also supported. Maybe they are and there is just a different syntax needed (then an example in the docs would be great).

Full example:

import pandas as pd
import panel as pn
import altair as alt
from vega_datasets import data

pn.extension('vega')
penguins_url = "https://raw.githubusercontent.com/vega/vega/master/docs/data/penguins.json"

brush = alt.selection_interval(name='brush')  # selection of type "interval"

chart = alt.Chart(penguins_url).mark_point().encode(
    x=alt.X('Beak Length (mm):Q', scale=alt.Scale(zero=False)),
    y=alt.Y('Beak Depth (mm):Q', scale=alt.Scale(zero=False)),
    color=alt.condition(brush, 'Species:N', alt.value('lightgray'))
).properties(
    width=250,
    height=250
).add_selection(
    brush
)


df = pd.read_json("https://raw.githubusercontent.com/vega/vega/master/docs/data/penguins.json")

vega_pane = pn.pane.Vega(chart)

def filtered_table(selection):
    if selection is None:
        return '## No selection'
    # query = ' & '.join(
    #     f'{crange[0]:.3f} <= `{col}` <= {crange[1]:.3f}'
    #     for col, crange in selection.items()
    # )
    print(selection)
    query = selection.items()
    return pn.Column(
        f'Query: {query}',
        # pn.pane.DataFrame(df.query(query), width=600, height=300)
    )

vega_pane = pn.pane.Vega(chart, debounce=1)
pn.Row(vega_pane, pn.bind(filtered_table, vega_pane.selection.param.brush)).show()
2 Likes