Panel HighCharts

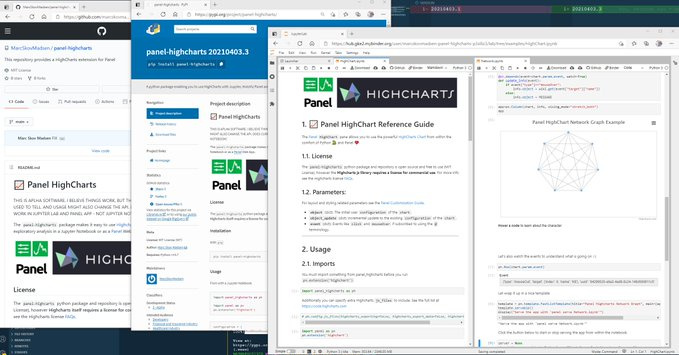
I’ve created a new package for Panel called panel-highcharts.

It adds support for HighCharts to Panel.

The panel-highcharts python package and repository is open source and free to use (MIT License), however Highcharts itself requires a license for commercial use . For more info see the Highcharts license FAQs.

Check it out

image

2 Likes

If you like this work and/ or would like to help communicate about Panel Highcharts please

Star the repo:

Retweet some tweets:


Thanks.

Please note the repository can also be seen as a reference example for creating a custom panel python package with bokeh extensions.

FYI. @Hoxbro

1 Like

I managed to serve the example notebooks as apps on Binder via jupyter-server-proxy. Even with a custom icon in Jupyter Labs. Pretty amazing. :slight_smile:

Binder is so perfect for sharing example notebooks and as a learning environment.

Check out the panel-highcharts examples on Binder

Jupyter Notebook Jupyter Labs Panel Apps
Binder Binder Binder

If you also want to custom launch Panel apps on Binder or on Jupyter Hub check out the jupyter-panel-highcharts-server module I made. It’s heavily inspired by holoviz/jupyter-panel-proxy: Jupyter Server Proxy for Panel (github.com).

I’ve added HighStock, HighMap, HighGantt panes to the panel-highcharts package.

Try it out on BINDER.

3 Likes

Nice work @Marc

I tried it with the todo list and it works ok.

Here is the code. It can be significantly improved if using classes and the recent discussion with child and parent components.

import numpy as np
import panel_highcharts as ph
import panel as pn
pn.extension('highgantt')

from datetime import datetime as dt

EPOCH = dt.utcfromtimestamp(0)

configuration = {
    "title": {"text": "Simple Gantt Chart"},
    'chart': {'backgroundColor':'#121212',
                'borderColor':'#121212'},
    "series": [
        {
            "name": "Project 1",
            "data": [],
        }
    ],
}

def convert_to_miliseconds(value):
    if not value == "":
        s_dt = dt.strptime(value, "%Y/%m/%d")
        return int((s_dt - EPOCH).total_seconds() * 1000)
    else:
        s_dt = dt.strptime(dt.today(), "%Y/%m/%d")
        return int((s_dt - EPOCH).total_seconds() * 1000)
            
for point in configuration["series"][0]["data"]: # type: ignore
    point["start"] = convert_to_miliseconds(point["start"])
    point["end"] = convert_to_miliseconds(point["end"])


import param

chart = ph.HighGantt(object=configuration, sizing_mode="stretch_width", height=600)


class Dic(param.Parameterized):
    d = param.Dict({})

def ToDoList(name): 
    state = Dic()

    def get_add_component():
        add_input = pn.widgets.TextInput(name='Add item', width=300, placeholder= 'to do list items')
        add_button = pn.widgets.Button(name='+', width=15, button_type='success', align='end')

        def add_item(event):
            if add_input.value not in list(state.d.keys()) and add_input.value != '':
                state.d = { **state.d, add_input.value:(False, None)}
                add_input.value = '' 
        add_button.on_click(add_item)
        
        @pn.depends(add_input.param.value, watch=True)
        def add_item_from_enter(value):
            if value not in state.d.keys() and value != '':
                state.d = { **state.d, value:(False, None)}
                add_input.value = ''
        return pn.Row(add_input, add_button)
   
    def get_item_list(text, done, dat):
        done = pn.widgets.Checkbox(value=done, width=15, align='end')
        textw = pn.pane.Markdown('### '+ text, width=155, margin=(0, 0, -8, 0), align='end')
#         date = pn.widgets.DatePicker(width=110, value=dat)
        date = pn.widgets.DatetimeRangePicker(width=110, value=dat)
        remove = pn.widgets.Button(name='x', width=15, button_type='danger', align='end')

        @pn.depends(done.param.value, watch=True)
        def update_done_state(value):
            state.d = {k:(value, v[1]) if k==text else v for k,v in state.d.items() }

        @pn.depends(date.param.value, watch=True)
        def update_done_state(value):
            state.d = {k:(v[0], value) if k==text else v for k,v in state.d.items() }

        def delete_item(event):
            state.d = {k:v for k,v in state.d.items() if k!=text}
        remove.on_click(delete_item)

        return pn.Row(done, textw, date, remove)

    @pn.depends(state.param.d)
    def view_list(val):
        return pn.Column(*[get_item_list(k,v[0], v[1]) for k,v in state.d.items()])

    return get_add_component(), view_list, state

add_component, view_list, state = ToDoList('list')

@pn.depends(state.param.d, watch=True)
def trigger(value):
#     configuration['series'][0]['data'] 
    print ('updateginggg')
    tasks = []
    for k, v in value.items():
        ide = k
        name = k
    #     print (k, 'is',v[0] is False, 'then',v[1] is not None)
    #     print (v==None, type(v[0])==type(False), v, isinstance(type(v[0]),type(None))       )
        if v[1] is not None:
            start = int((v[1][0]- dt.utcfromtimestamp(0)).total_seconds())*1000 
            end = int((v[1][1]- dt.utcfromtimestamp(0)).total_seconds())*1000 
        else:
            start, end = None, None
            #  int((dt.today()- dt.utcfromtimestamp(0)).total_seconds())*1000 
            # end = int((dt.today()- dt.utcfromtimestamp(0)).total_seconds())*1000 

        tasks.append(({'id':ide, 'name':name, 'start':start,'end':end}))
    print (tasks)
    configuration['series'][0]['data']  = tasks
    # chart.object_update = {k:v for k,v in configuration.items()}
    chart.object_update =  {'series':{
                                        "name": "Project 1",
                                        "data": tasks
                                    }
                            } 
    # {'series': configuration['series']}.copy()
    # chart.param.trigger('object')


btn = pn.widgets.Button(name ='delete all', button_type='danger')
def delete_all(event):
    state.d = {}
btn.on_click(delete_all)

row = pn.Row( pn.Column(add_component, view_list),
              pn.Spacer(width=15),  
#               pn.Column(state.param.d,btn),
            pn.Row(chart, sizing_mode='stretch_width')
            )

tmpl = pn.template.VanillaTemplate(title='Gantt Chart',
            theme= pn.template.DarkTheme)
tmpl.main.append(row)

tmpl.servable()
2 Likes

I improved this example with the classes approach and a parent and a child component…

import param 
import panel as pn, numpy as np
import panel_highcharts as ph
pn.extension('highgantt')

from datetime import datetime as dt

EPOCH = dt.utcfromtimestamp(0)
configuration = {"title": {"text": ''},
                 "series": [ {"name": "Project 1",
                              "data": [],}
                            ] }

def convert_to_miliseconds(value):
    if not value == "":
        s_dt = dt.strptime(value, "%Y/%m/%d")
        return int((s_dt - EPOCH).total_seconds() * 1000)
    else:
        return None
        # s_dt = dt.strptime(dt.today(), "%Y/%m/%d")
        # return int((s_dt - EPOCH).total_seconds() * 1000)

class ToDoList(param.Parameterized):
    state = param.Dict({})
  
    def adder(self):
        add_input = pn.widgets.TextInput(name='Add item', width=300, placeholder= 'to do list items')
        add_button = pn.widgets.Button(name='+', width=15, button_type='success', align='end')

        def add_item(event):
            if add_input.value not in list(self.state.keys()) and add_input.value != '':
                self.state = { **self.state, add_input.value:(False, None)}
                add_input.value = '' 
        add_button.on_click(add_item)

        @pn.depends(add_input.param.value, watch=True)
        def add_item_from_enter(value):
            if value not in self.state.keys() and value != '':
                self.state = { **self.state, value:(False, None)}
                add_input.value = ''

        return pn.Row(add_input,add_button)

    def get_item_list(self, text, done, dat):
        done = pn.widgets.Checkbox(value=done, width=15, align='end')
        textw = pn.pane.Markdown('### '+ text, width=155, margin=(0, 0, -8, 0), align='end')
        date = pn.widgets.DatetimeRangePicker(width=110, value=dat)
        remove = pn.widgets.Button(name='x', width=15, button_type='danger', align='end')

        @pn.depends(done.param.value, watch=True)
        def update_done(value):
            self.state = {k:(value, v[1]) if k==text else v for k,v in self.state.items() }

        @pn.depends(date.param.value, watch=True)
        def update_date(value):
            self.state = {k:(v[0], value) if k==text else v for k,v in self.state.items() }

        def delete_item(event):
            self.state = {k:v for k,v in self.state.items() if k!=text}
        remove.on_click(delete_item)

        return pn.Row(done, textw, date, remove)

    def view_list(self):
        return pn.Column(*[self.get_item_list(k,v[0], v[1]) for k,v in self.state.items()])


class Gantt(param.Parameterized):
    parent = param.Parameter()

    def __init__(self, **params):
        super().__init__(**params)
        self.chart = ph.HighGantt(object=configuration, sizing_mode="stretch_width", 
                                height=400)

    @param.depends('parent.state', watch=True)
    def update_chart(self):
        tasks = []
        
        for k, v in self.parent.state.items():
            ide, name = k, k
            if v[1] is not None:
                start = int((v[1][0]- dt.utcfromtimestamp(0)).total_seconds())*1000 
                end = int((v[1][1]- dt.utcfromtimestamp(0)).total_seconds())*1000 
            else:
                start, end = None, None
            tasks.append(({'id':ide, 'name':name, 'start':start,'end':end}))
        # configuration['series'][0]['data']  = tasks
        self.chart.object_update =  {'series':[{"name":"Project 1","data":tasks}]}
      

todo = ToDoList()
gantt = Gantt(parent=todo)

todo2 = ToDoList()
gantt2 = Gantt(parent=todo2)

header = pn.Row(pn.Spacer(sizing_mode='stretch_width'),
            pn.pane.PNG('lis.png', width = 600),
            pn.Spacer(sizing_mode='stretch_width'),sizing_mode='stretch_width')

body = pn.Row(pn.Column(todo.adder,
                todo.view_list),
    gantt.chart,sizing_mode='stretch_width')
    

body2 = pn.Row(pn.Column(todo2.adder,
                todo2.view_list, ),
    gantt2.chart,
    )

print (gantt.parent.state.values())
    
pn.Column(header, 
        '## Project1', body, 
        '## Project2', body2, 
        sizing_mode='stretch_width').servable()
3 Likes

月光 asked my HOW DO I CREATE A PACKED BUBBLE CHART USING #Python and the PANEL-HIGHCHARTS package?

I created an EXAMPLE NOTEBOOK to answer.

Notebook: Binder

Repo: GitHub - MarcSkovMadsen/panel-highcharts: This repository provides a HighCharts extension for Panel

2 Likes