Panel - JSCallback function

Stackoverflow question can be found here:
Panel - JSCallback function - Linking stream data to a JSObject in Echarts within a Panel dashboard

My 2 major questions:

  • How do I access the JSObject in Echart Gauge or other Echarts correctly?
  • In my case would linking be correct or is the Callback function the right path?

Thank you very much for clarifcation and tips!

1 Like

Hi

There is no easy way to call a jscallback from python, I think, but I am not sure.

I think your problem is related there is no pn.state.jscallback (or maybe I am not aware of that).

I added a dummy slider, which is not visible, to use the callback attached to this slider. When you change the slider value, the callback is triggered internally by panel. This is good because the js_callback always has a cb_obj object in the javascript code, which you can use to pass the temperature generated with the random.randint function. I think you do not need to define the temperature global in that case either.

echa


import time
import panel as pn
import random

random.seed()

def read_temp():
    return random.randint(15, 30)

global temperature
temperature = read_temp()

slider = pn.widgets.FloatSlider(visible=False)

# Stream function
def stream():
    temperature = read_temp()
    print('in python', temperature)
    #how to access the js object?
    slider.value = random.randint(0, 30) # this step triggers internally the js_callback attached to the slider 

gauge = {
    'tooltip': {
        'formatter': '{a} <br/>{b} : {c}°C'
    },
    'series': [
        {
            'name': 'Gauge',
            'type': 'gauge',
            'detail': {'formatter': '{value}°C'},
            'data': [{'value': [temperature], 'name': 'Temperature'}]
        }
    ]
};

# Set up callback with streaming data
pn.state.add_periodic_callback(stream, 500)

#Panel
pn.extension('echarts',sizing_mode="stretch_width",template="fast")
ACCENT = "orange"
pn.state.template.param.update(site="Test", title="Introduction to data apps with Panel", 
                               sidebar_width=200, accent_base_color=ACCENT, 
                               header_background=ACCENT, font="Montserrat")

gauge_pane = pn.pane.ECharts(gauge,width=400, height=400)

row = pn.Row(gauge_pane,slider).servable()

slider.jscallback(args={'gauge': gauge_pane}, value="""
    console.log( 'dummy slider:', cb_obj.value, 
            'gauge value',gauge.data.series[0].data[0].value);
    gauge.data.series[0].data[0].value = cb_obj.value;
    gauge.properties.data.change.emit()"""
    )


# pn.pane.JPG("logo.jpg", sizing_mode="scale_width", embed=False).servable(area="sidebar")
pn.panel("# Settings").servable(area="sidebar")
3 Likes

Thank you very much - this was not obvious to me - to add an invisible slider - So I asked as i could not find a function in the documentation. Easy fix that is a little bit a workaround :slight_smile:

I tried the same for linechart and it did not work with the following code:

def retrieve():
    values = df['root.myfactory.machine1.temperature'].values.tolist()
    timevalues = df.Time.values.tolist()
    return values, timevalues
    
# invisible slider to jscallback
slider = pn.widgets.FloatSlider(visible=False)
# Stream function
def stream():
    #update linechart
    values, timevalues = retrieve()
    slider.value = values
    slider.timevalue = timevalues
    # this step triggers internally the js_callback attached to the slider 
#callback
pn.state.add_periodic_callback(stream, 250)
# Linechart
echart = {
    'title': {
        'text': 'Temperature over Time'
    },
    'tooltip': {},
    'legend': {
        'data':['Temperature over time']
    },
    'xAxis': {
        'data': timevalues
    },
    'yAxis': {},
    'series': [{
        'name': 'Temperature',
        'type': 'bar',
        'data': values
    }],
};

echart['series'] = [dict(echart['series'][0], type= 'line')]
responsive_spec = dict(echart, responsive=True)
echart_pane = pn.pane.ECharts(responsive_spec, height=400)
row = pn.Row(echart_pane,slider).servable()
# js callback functions
slider.jscallback(args={'echart': echart_pane}, value="""
    console.log( 'dummy slider:', cb_obj.value, cb_obj.timevalue
            'echart value',echart.data.series[2].data, echart.xAxis.data);
    echart.data.series[2].data = cb_obj.value;
    echart.xAxis.data = cb_obj.timevalue;
    echart.properties.data.change.emit()"""
    )```

It is not so easy to debug the code as it just does not work -> Any hints on how I can debug and see what I need to change in the JavaScrip part to get live updating Linecharts from the ECharts library in Panel?

Hi @otluk

The workaround or hacky code for the gauge has several details which need consideration. The simple solution to stream data from a pandas dataframe would be to watch other solutions, for example, the one shown here

Said that, we can look how to apply the same workaround for sending data for the line chart. We can consider panel is something like a full-stack framework, which connects the backend(python) with the frontend (the browser). How panel does that is something like magic, sending data back and forth (serializing to json the data you want to communicate). In the previous example, you only want to send the type of data a number, then we use an slider, which has a attribute slider.value, of type number. In this case, if you want to send data which consists of timestamps and values, another widget must be used which can support that type of data. The pn.widgets.literal_input can do that work (LiteralInput — Panel v1.3.5). It is noteworthy to mention the difference between the slider previously used and the literal_input, the former only accepts numbers, while the latter can accept numbers, lists or dicts.

You can find below the code. The conversion of the data in the javascript callback took me a while, and it is something panel has done in its code, so this is something like reinventing the wheel. Due to that, it is better to use the first example given in the link.
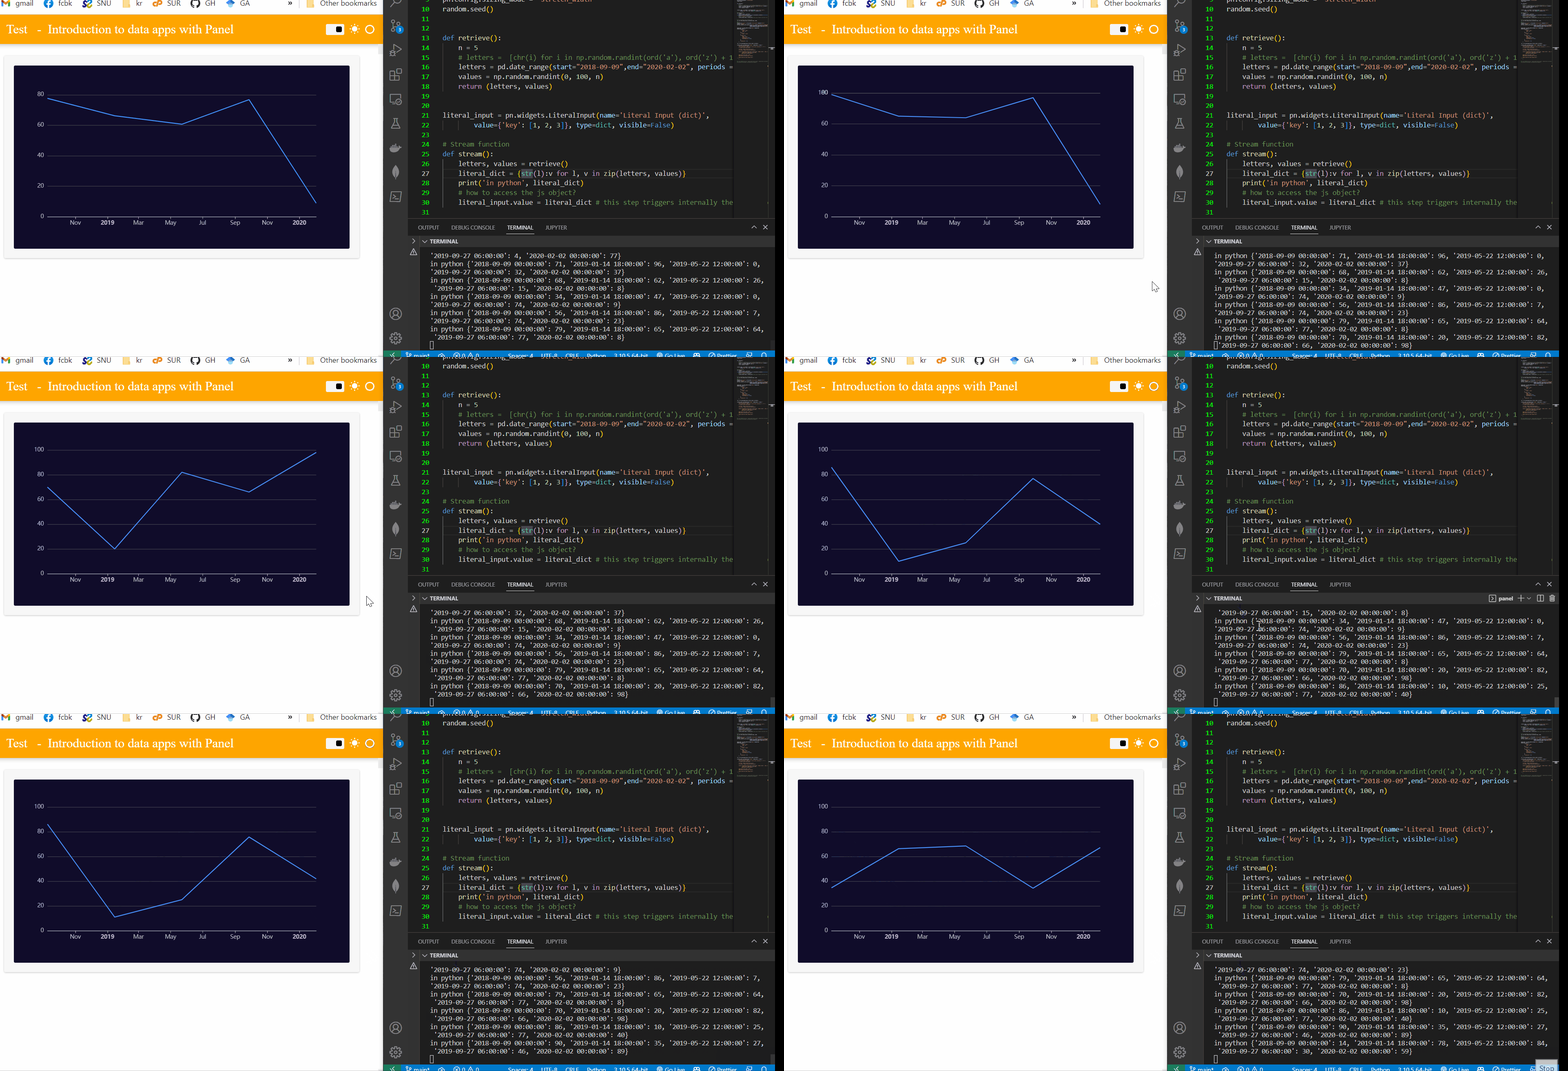
echart_timeseries


import time
import panel as pn, pandas as pd 
import random, numpy as np

from datetime import datetime

pn.config.sizing_mode = 'stretch_width'
random.seed()


def retrieve():
    n = 5
    # letters =  [chr(i) for i in np.random.randint(ord('a'), ord('z') + 1, n)]
    letters = pd.date_range(start="2018-09-09",end="2020-02-02", periods = 5).to_pydatetime().tolist() 
    values = np.random.randint(0, 100, n)  
    return (letters, values)


literal_input = pn.widgets.LiteralInput(name='Literal Input (dict)', 
        value={'key': [1, 2, 3]}, type=dict, visible=False)

# Stream function
def stream():
    letters, values = retrieve()
    literal_dict = {str(l):v for l, v in zip(letters, values)}
    print('in python', literal_dict)
    # how to access the js object?
    literal_input.value = literal_dict # this step triggers internally the js_callback attached to the slider 


# Set up callback with streaming data
cb = pn.state.add_periodic_callback(stream, 2000)

# Panel
pn.extension('echarts',sizing_mode="stretch_width",template="fast")
ACCENT = "orange"
pn.state.template.param.update(site="Test", title="Introduction to data apps with Panel", 
                               sidebar_width=200, accent_base_color=ACCENT, 
                               header_background=ACCENT, font="Montserrat")

gauge_pane = pn.pane.ECharts(theme="dark", height=400)
gauge_pane.object = {
        "xAxis": {
            "type": 'time',
            "data": []
        },
        "yAxis": {
            "type": 'value'
        },
        "series": [{
            "data": [],
            "type": 'line',
            "showSymbol": False,
            "hoverAnimation": False,
        },
        ],
        "responsive": True
    }

row = pn.Column(gauge_pane,literal_input).servable()

literal_input.jscallback(args={'gauge': gauge_pane,}, value="""
    console.log(cb_obj.value)
    let literal_dict = JSON.parse( cb_obj.value.replaceAll("'",'\"') )
    // console.log(literal_dict)
    
    let keys = Object.keys(literal_dict);
    let values = Object.entries(literal_dict);

    console.log(typeof(literal_dict),literal_dict, 'dummy slider:', keys, values ,
            'gauge value',gauge.data.xAxis.data, 
           gauge.data.series[0].data );

    gauge.data.xAxis.data = keys;
    gauge.data.series[0].data = values;

    gauge.properties.data.change.emit()
"""
    )

# pn.pane.JPG("logo.jpg", sizing_mode="scale_width", embed=False).servable(area="sidebar")
# pn.panel("# Settings").servable(area="sidebar")
1 Like

Here is the code with a few modifications, ff you want to accumulate the data in the linechart. The data is sent to the frontend and saved in the echart plot, but it is not saved in the server.

import time
import panel as pn, pandas as pd 
import random, numpy as np

from datetime import datetime, timedelta

pn.config.sizing_mode = 'stretch_width'
random.seed()

offset = 0 
def retrieve():
    n = 5
    global offset
    offset += n + 2
    # letters =  [chr(i) for i in np.random.randint(ord('a'), ord('z') + 1, n)]
    letters = pd.date_range(start=datetime(2018,9,9) + timedelta(days=offset),
                    end=datetime(2018,9,15) + timedelta(days=offset), 
                    periods = 5).to_pydatetime().tolist() 
    values = np.random.randint(0, 100, n)  
    return (letters, values)


literal_input = pn.widgets.LiteralInput(name='Literal Input (dict)', 
        value={'key': [1, 2, 3]}, type=dict, visible=False)

# Stream function
def stream():
    letters, values = retrieve()
    literal_dict = {str(l):v for l, v in zip(letters, values)}
    print('in python', literal_dict)
    # how to access the js object?
    literal_input.value = literal_dict # this step triggers internally the js_callback attached to the slider 


# Set up callback with streaming data
cb = pn.state.add_periodic_callback(stream, 50)

#Panel
pn.extension('echarts',sizing_mode="stretch_width",template="fast")
ACCENT = "orange"
pn.state.template.param.update(site="Test", title="Introduction to data apps with Panel", 
                               sidebar_width=200, accent_base_color=ACCENT, 
                               header_background=ACCENT, font="Montserrat")

gauge_pane = pn.pane.ECharts(theme="dark", height=400)
gauge_pane.object = {
        "xAxis": {
            "type": 'time',
            "data": []
        },
        "yAxis": {
            "type": 'value'
        },
        "animation": False,
        "series": [{
            "data": [],
            "type": 'line',
            "showSymbol": False,
            "hoverAnimation": False,
        },
        ],
        "responsive": True
    }

row = pn.Column(gauge_pane,literal_input).servable()

literal_input.jscallback(args={'gauge': gauge_pane,}, value="""
    console.log(cb_obj.value)
    let literal_dict = JSON.parse( cb_obj.value.replaceAll("'",'\"') )
    // console.log(literal_dict)
    
    let keys = Object.keys(literal_dict);
    let values = Object.entries(literal_dict);

    console.log(typeof(literal_dict),literal_dict, 'dummy slider:', keys, values ,
            'gauge value',gauge.data.xAxis.data, 
           gauge.data.series[0].data );

    gauge.data.xAxis.data = [...gauge.data.xAxis.data, ...keys].slice(-1000);
    gauge.data.series[0].data = [...gauge.data.series[0].data, ...values].slice(-1000);

    gauge.properties.data.change.emit()
"""
    )


# pn.pane.JPG("logo.jpg", sizing_mode="scale_width", embed=False).servable(area="sidebar")
# pn.panel("# Settings").servable(area="sidebar")

1 Like

This is brilliant! Here’s a stripped down version

import panel as pn

pn.extension()

def trigger_js(event):
    dummy_input.value += 1

dummy_input = pn.widgets.IntInput(visible=False)
dummy_input.jscallback(**{"value": "console.log('I see you clicked!')"})

button = pn.widgets.Button(name="Click me!!")
button.on_click(trigger_js)
pn.Row(button, dummy_input).servable()