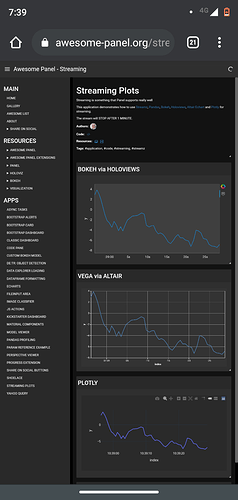
A question here on discourse got me started on Streaming.
This is a simple example but so powerful. This a quick and dirty implementation. Don’t yet know how to do this in the best way.
Wanted to share because I have not seen so many examples of streaming with Panel yet.
I don’t understand every detail. If you want to understand it check out the reference guide https://panel.holoviz.org/reference/panes/Streamz.html#panes-gallery-streamz. This example is very much inspired by that.
streaming_echarts
import numpy as np
import altair as alt
import pandas as pd
import panel as pn
from streamz.dataframe import DataFrame as sDataFrame
alt.renderers.set_embed_options(theme='dark')

df = sDataFrame(example=pd.DataFrame({'y': []}, index=pd.DatetimeIndex([])))

echarts_panel = pn.pane.ECharts(theme="dark")

def line_plot(data):
    data = pd.concat(data).reset_index()
    echarts_panel.object = {
        "xAxis": {
            "type": 'category',
            "data": list(data.index.values)
        },
        "yAxis": {
            "type": 'value'
        },
        "series": [{
            "data": list(data["y"]),
            "type": 'line',
            "showSymbol": False,
            "hoverAnimation": False,
        },
        ],
        "responsive": True
    }
    return echarts_panel
    # return alt.Chart(pd.concat(data).reset_index(), width='container').mark_line().encode(
    #     x='index',
    #     y='y',
    # )

plot_stream = df.cumsum().stream.sliding_window(50).map(line_plot)

plot_pane = pn.pane.Streamz(plot_stream, height=350, sizing_mode="stretch_width", always_watch=True)

for i in range(100):
    df.emit(pd.DataFrame({'y': [np.random.randn()]}, index=pd.DatetimeIndex([pd.datetime.now()])))

def emit():
    df.emit(pd.DataFrame({'y': [np.random.randn()]}, index=pd.DatetimeIndex([pd.datetime.now()])))

pn.state.add_periodic_callback(emit, period=100, count=500)

layout = pn.template.ReactTemplate(
    site="Awesome Panel", title="Streaming w. Echarts", theme=pn.template.react.DarkTheme, row_height=350
)
layout.main[0, 0:6]=plot_pane
layout.main[0, 6:12]=plot_pane.clone()
layout.main[1, 0:6]=plot_pane.clone()
layout.main[1, 6:12]=plot_pane.clone()
layout.servable()

 )
)

