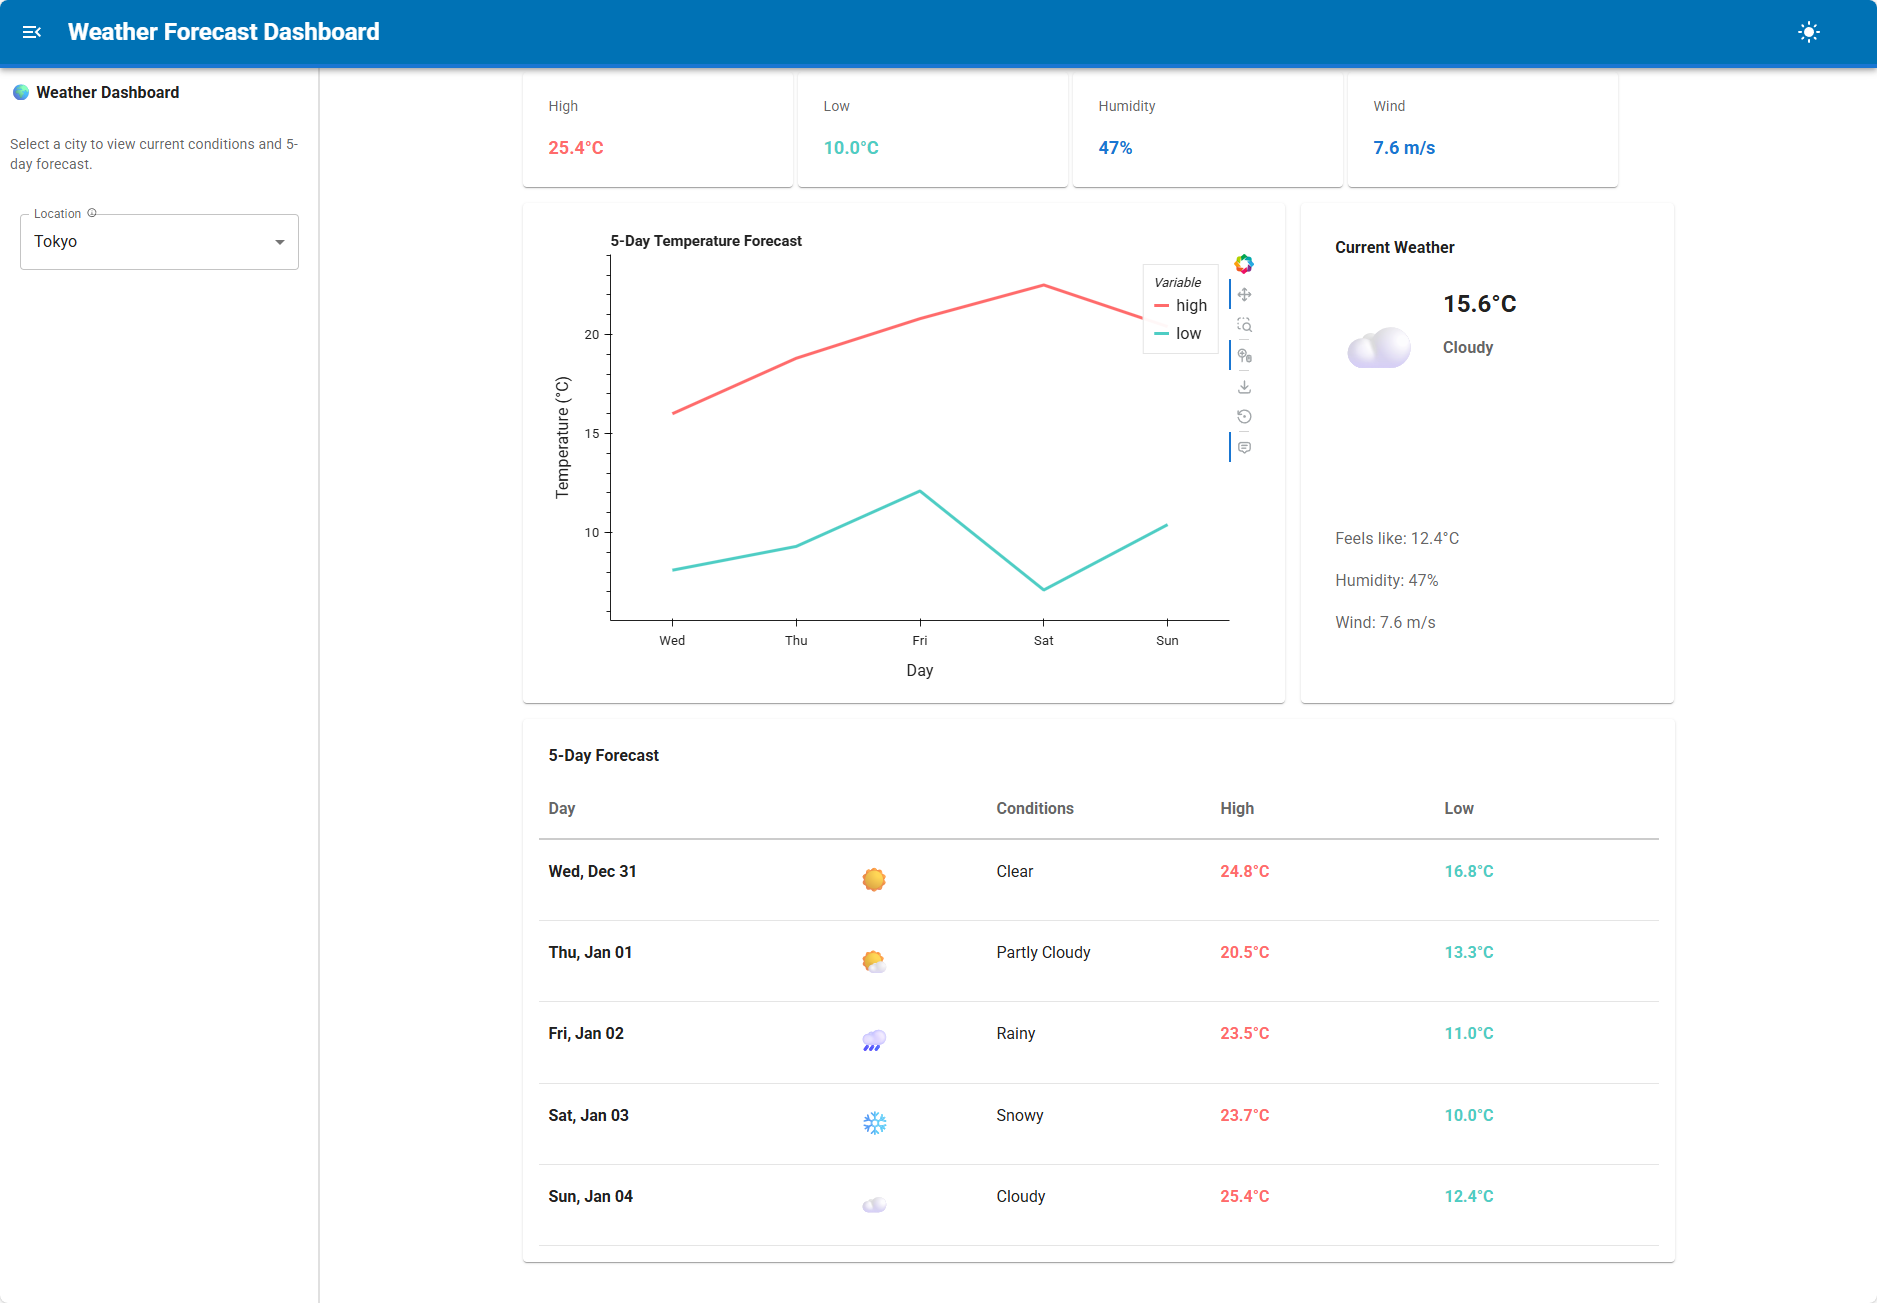
Created this in a few iterations and 20 mins using latest versions of panel-material-ui and copilot with holoviz-mcp.
Code
# weather_dashboard.py
import numpy as np
import pandas as pd
import panel as pn
import panel_material_ui as pmui
import param
import hvplot.pandas  # noqa

pn.extension(throttled=True)

# Constants
CITIES = ["New York", "London", "Tokyo", "Sydney", "Paris"]
WEATHER_CONDITIONS = {
    "Clear": "☀️",
    "Partly Cloudy": "🌤️",
    "Cloudy": "☁️",
    "Rainy": "🌧️",
    "Stormy": "⛈️",
    "Snowy": "❄️",
}

# Extract Data (Mock)

@pn.cache(max_items=10, ttl=600)
def get_weather_data(city):
    """Generate realistic mock weather data for a city"""
    np.random.seed(hash(city) % 2**32)  # Consistent data per city

    # Base temperatures by city
    base_temps = {
        "New York": 15,
        "London": 12,
        "Tokyo": 18,
        "Sydney": 25,
        "Paris": 14,
    }

    base_temp = base_temps.get(city, 20)

    # Current weather
    current = {
        "city": city,
        "temperature": round(base_temp + np.random.uniform(-5, 5), 1),
        "feels_like": round(base_temp + np.random.uniform(-7, 3), 1),
        "humidity": int(np.random.uniform(40, 85)),
        "wind_speed": round(np.random.uniform(5, 25), 1),
        "condition": np.random.choice(list(WEATHER_CONDITIONS.keys())),
    }

    # 5-day forecast
    dates = pd.date_range(start=pd.Timestamp.now().normalize(), periods=5, freq='D')
    forecast = pd.DataFrame({
        "date": dates,
        "high": [round(base_temp + np.random.uniform(0, 8), 1) for _ in range(5)],
        "low": [round(base_temp + np.random.uniform(-8, 0), 1) for _ in range(5)],
        "condition": [np.random.choice(list(WEATHER_CONDITIONS.keys())) for _ in range(5)],
    })

    return {"current": current, "forecast": forecast}

# Transform Data

def get_current_weather(city):
    """Get current weather conditions"""
    data = get_weather_data(city)
    return data["current"]

def get_forecast_df(city):
    """Get forecast as DataFrame"""
    data = get_weather_data(city)
    df = data["forecast"].copy()
    df["day"] = df["date"].dt.strftime("%a, %b %d")
    df["icon"] = df["condition"].map(WEATHER_CONDITIONS)
    return df

# Plot Creation

def create_temperature_chart(df):
    """Create temperature trend chart"""
    df_plot = df.copy()
    df_plot["day_short"] = df_plot["date"].dt.strftime("%a")

    return df_plot.hvplot.line(
        x="day_short",
        y=["high", "low"],
        title="5-Day Temperature Forecast",
        ylabel="Temperature (°C)",
        xlabel="Day",
        height=300,
        responsive=True,
        color=["#FF6B6B", "#4ECDC4"],
        line_width=3,
        legend="top_right",
        tools=["hover"],
    )

# Main Dashboard Component

class WeatherDashboard(pn.viewable.Viewer):
    """Weather forecast dashboard with current conditions and 5-day forecast"""

    city = param.Selector(
        default="New York",
        objects=CITIES,
        doc="Select city for weather forecast"
    )

    dark_theme = param.Boolean(default=False, allow_refs=True, doc="Dark theme enabled")

    def __init__(self, **params):
        super().__init__(**params)

        with pn.config.set(sizing_mode="stretch_width"):
            # Create inputs
            self._city_selector = pmui.Select.from_param(
                self.param.city,
                label="Location",
                margin=(10, 20)
            )

            self._inputs = pmui.Column(
                pmui.Typography(
                    "🌍 Weather Dashboard",
                    variant="h6",
                    sx={"mb": 2, "fontWeight": 600}
                ),
                self._city_selector,
                max_width=300,
            )

            # Create static output panes with reactive content
            self._kpi_pane = self._kpi_indicators

            self._current_weather_pane = pmui.Paper(
                self._current_weather_card,
                height=500,
                sx={"p": 3}
            )

            self._chart_pane = pmui.Paper(
                pn.pane.HoloViews(self.param.temperature_chart, sizing_mode="stretch_both"),
                height=500,
                sx={"p": 2}
            )

            self._forecast_pane = pmui.Paper(
                self._forecast_table,
                sx={"p": 2}
            )

            # Layout outputs in responsive grid
            grid = pmui.Grid(
                pmui.Grid(self._kpi_pane, size={"xs": 12}),
                pmui.Grid(self._chart_pane, size={"xs": 12, "md": 8}),
                pmui.Grid(self._current_weather_pane, size={"xs": 12, "md": 4}),
                pmui.Grid(self._forecast_pane, size={"xs": 12}),
                container=True,
                spacing=2,
            )

            # Wrap in a Grid container with max-width and centering
            self._outputs = pmui.Container(
                grid,
            )

    @param.depends("city", watch=True, on_init=True)
    def _update_chart(self):
        """Update temperature chart when city changes"""
        df = get_forecast_df(self.city)
        self.temperature_chart = create_temperature_chart(df)

    temperature_chart = param.Parameter(doc="Temperature forecast chart")

    @param.depends("city")
    def _kpi_indicators(self):
        """Display key performance indicators"""
        current = get_current_weather(self.city)
        df = get_forecast_df(self.city)

        kpi_style = {
            "textAlign": "center",
            "p": 2,
        }

        return pmui.FlexBox(
            pmui.Paper(
                pmui.Column(
                    pmui.Typography("High", variant="body2", sx={"color": "text.secondary"}),
                    pmui.Typography(
                        f"{df['high'].max()}°C",
                        variant="h5",
                        sx={"fontWeight": 700, "color": "#FF6B6B"}
                    ),
                ),
                sx=kpi_style, sizing_mode="fixed", width=270,
            ),
            pmui.Paper(
                pmui.Column(
                    pmui.Typography("Low", variant="body2", sx={"color": "text.secondary"}),
                    pmui.Typography(
                        f"{df['low'].min()}°C",
                        variant="h5",
                        sx={"fontWeight": 700, "color": "#4ECDC4"}
                    ),
                ),
                sx=kpi_style, sizing_mode="fixed", width=270,
            ),
            pmui.Paper(
                pmui.Column(
                    pmui.Typography("Humidity", variant="body2", sx={"color": "text.secondary"}),
                    pmui.Typography(
                        f"{current['humidity']}%",
                        variant="h5",
                        sx={"fontWeight": 700, "color": "primary.main"}
                    ),
                ),
                sx=kpi_style, sizing_mode="fixed", width=270,
            ),
            pmui.Paper(
                pmui.Column(
                    pmui.Typography("Wind", variant="body2", sx={"color": "text.secondary"}),
                    pmui.Typography(
                        f"{current['wind_speed']} m/s",
                        variant="h5",
                        sx={"fontWeight": 700, "color": "primary.main"}
                    ),
                ),
                sx=kpi_style, sizing_mode="fixed", width=270,
            ),
            flex_direction="row",
            align_content='space-evenly',
            gap="5px",
        )

    @param.depends("city")
    def _current_weather_card(self):
        """Display current weather conditions"""
        current = get_current_weather(self.city)
        icon = WEATHER_CONDITIONS.get(current["condition"], "🌡️")

        return pmui.Column(
            pmui.Typography(
                "Current Weather",
                variant="h6",
                sx={"mb": 2, "fontWeight": 600}
            ),
            pmui.Row(
                pmui.Typography(
                    icon,
                    sx={"fontSize": "4rem", "mr": 2}
                ),
                pmui.Column(
                    pmui.Typography(
                        f"{current['temperature']}°C",
                        variant="h3",
                        sx={"fontWeight": 700, "lineHeight": 1}
                    ),
                    pmui.Typography(
                        current["condition"],
                        variant="h6",
                        sx={"color": "text.secondary"}
                    ),
                ),
            ),
            pmui.Typography(
                f"Feels like: {current['feels_like']}°C",
                variant="body1",
                sx={"mt": 2, "color": "text.secondary"}
            ),
            pmui.Typography(
                f"Humidity: {current['humidity']}%",
                variant="body1",
                sx={"color": "text.secondary"}
            ),
            pmui.Typography(
                f"Wind: {current['wind_speed']} m/s",
                variant="body1",
                sx={"color": "text.secondary"}
            ),
        )

    @param.depends("city")
    def _forecast_table(self):
        """Display 5-day forecast"""
        df = get_forecast_df(self.city)

        rows = []
        with pn.config.set(sizing_mode="stretch_width"):
            for _, row in df.iterrows():
                rows.append(
                    pmui.Row(
                        pmui.Typography(row["day"], sx={"flex": 2, "fontWeight": 600}),
                        pmui.Typography(row["icon"], sx={"flex": 1, "fontSize": "1.5rem", "textAlign": "center"}),
                        pmui.Typography(row["condition"], sx={"flex": 2}),
                        pmui.Typography(f"{row['high']}°C", sx={"flex": 1, "color": "#FF6B6B", "fontWeight": 600}),
                        pmui.Typography(f"{row['low']}°C", sx={"flex": 1, "color": "#4ECDC4", "fontWeight": 600}),
                        sx={"borderBottom": "1px solid rgba(0,0,0,0.1)", "py": 1.5}
                    )
                )

            return pmui.Column(
                pmui.Typography(
                    "5-Day Forecast",
                    variant="h6",
                    sx={"mb": 2, "fontWeight": 600}
                ),
                pmui.Row(
                    pmui.Typography("Day", sx={"flex": 2, "fontWeight": 700, "color": "text.secondary"}),
                    pmui.Typography("", sx={"flex": 1}),
                    pmui.Typography("Conditions", sx={"flex": 2, "fontWeight": 700, "color": "text.secondary"}),
                    pmui.Typography("High", sx={"flex": 1, "fontWeight": 700, "color": "text.secondary"}),
                    pmui.Typography("Low", sx={"flex": 1, "fontWeight": 700, "color": "text.secondary"}),
                    sx={"borderBottom": "2px solid rgba(0,0,0,0.2)", "pb": 1}
                ),
                *rows,
            )

    def __panel__(self):
        return pmui.Row(self._inputs, self._outputs)

    @classmethod
    def create_app(cls, **params):
        """Create the servable dashboard app"""
        dashboard = cls(**params)

        page = pmui.Page(
            title="Weather Forecast Dashboard",
            sidebar=[
                pmui.Typography(
                    "🌍 Weather Dashboard",
                    variant="h6",
                    sx={"mb": 2, "fontWeight": 600}
                ),
                pmui.Typography(
                    "Select a city to view current conditions and 5-day forecast.",
                    variant="body2",
                    sx={"mb": 3, "color": "text.secondary"}
                ),
                dashboard._city_selector,
            ],
            main=[dashboard._outputs],
            dark_theme=dashboard.dark_theme,
        )

        # Synchronize Page theme to dashboard theme
        dashboard.dark_theme = page.param.dark_theme

        return page

# Serve the app

if __name__ == "__main__":
    WeatherDashboard.create_app().show(port=5007, autoreload=True, open=True)
elif pn.state.served:
    WeatherDashboard.create_app().servable()