Panel object not rendering in HTML

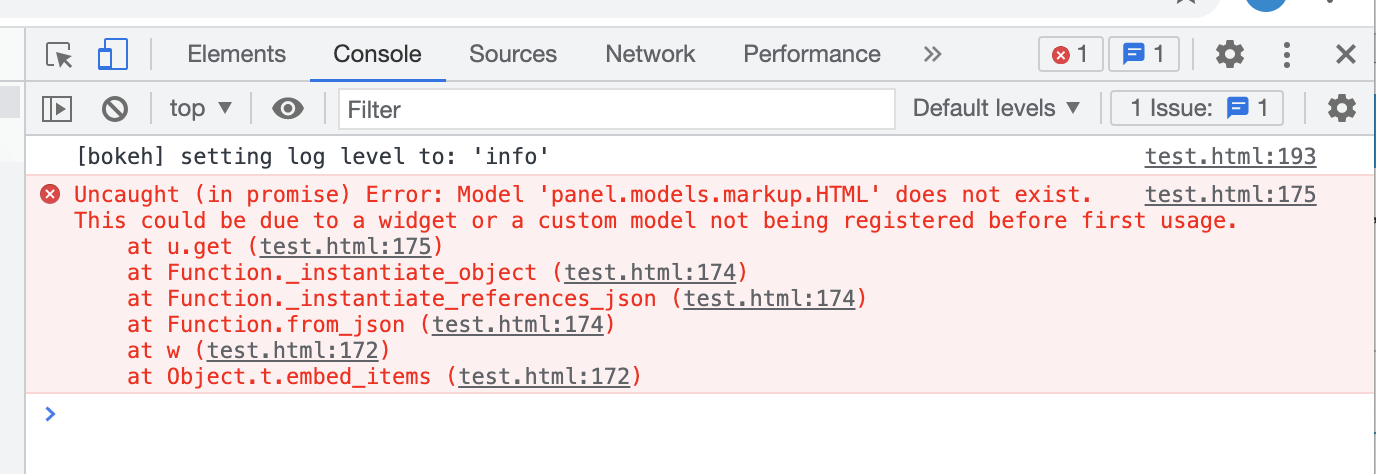
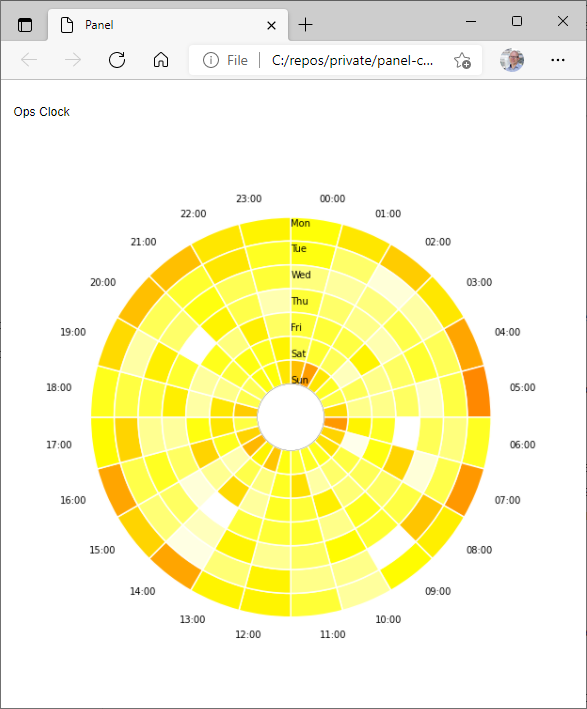
I created a time wheel by converting a matplotlib graphic I found here to bokeh using panel. This seems to work well (see image below) and I can display the graphic in a Jupyter notebook fine. However when I try to convert this to html using Jinja (a method which works well for some of my other visualizations), the resulting html shows up as blank. I am not sure how to explain this. Please advise.

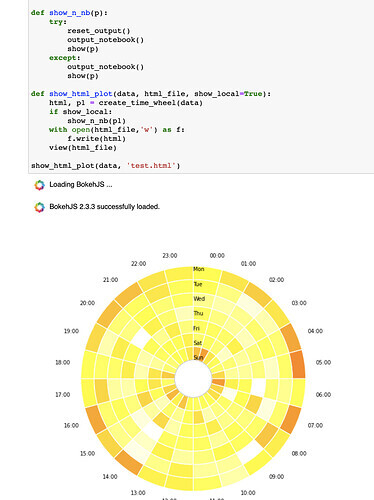
Jupyter notebook rendering of time wheel
image

My code:

import pandas as pd
import matplotlib.pyplot as plt
import numpy as np
import pandas as pd
import matplotlib as mpl
import matplotlib.cm as cm
import calendar
import pandas as pd
import matplotlib.pyplot as plt
import numpy as np
import pandas as pd
import matplotlib as mpl
import matplotlib.cm as cm
import calendar
from jinja2 import Template
from bokeh.resources import INLINE
from io import BytesIO
from bokeh.util.browser import view
from bokeh.layouts import row, column
from bokeh.embed import components
import panel as pn
from bokeh.plotting import figure, output_file, reset_output
from bokeh.io import output_notebook, show


# generate the table with timestamps
np.random.seed(1)
times = pd.Series(pd.to_datetime("Nov 1 '16 at 0:42") + pd.to_timedelta(np.random.rand(10000)*60*24*40, unit='m'))
# generate counts of each (weekday, hour)
data = pd.crosstab(times.dt.weekday, times.dt.hour.apply(lambda x: '{:02d}:00'.format(x))).fillna(0)
data.index = [calendar.day_name[i][0:3] for i in data.index]


def pie_heatmap(table, cmap=cm.hot, vmin=None, vmax=None,inner_r=0.25, pie_args={}):
    n, m = table.shape
    vmin= table.min().min() if vmin is None else vmin
    vmax= table.max().max() if vmax is None else vmax

    centre_circle = plt.Circle((0,0),inner_r,edgecolor='black',facecolor='white',fill=True,linewidth=0.25)
    plt.gcf().gca().add_artist(centre_circle)
    norm = mpl.colors.Normalize(vmin=vmin, vmax=vmax)
    cmapper = cm.ScalarMappable(norm=norm, cmap=cmap)
    for i, (row_name, row) in enumerate(table.iterrows()):
        labels = None if i > 0 else table.columns
        wedges = plt.pie([1] * m,radius=inner_r+float(n-i)/n, colors=[cmapper.to_rgba(x) for x in row.values], 
            labels=labels, startangle=90, counterclock=False, wedgeprops={'linewidth':-1}, **pie_args)
        plt.setp(wedges[0], edgecolor='white',linewidth=1.5)
        wedges = plt.pie([1], radius=inner_r+float(n-i-1)/n, colors=['w'], labels=[row_name], startangle=-90, wedgeprops={'linewidth':0})
        plt.setp(wedges[0], edgecolor='white',linewidth=1.5)
    plt.switch_backend('Agg')


# create html using script and div with jinja template
def create_html(title, script, div):
    template = Template("""\
    <!DOCTYPE html>
    <html lang="en">
        <head>
            <meta charset="utf-8">
            <title>""" + title + """"</title>
            {{ resources }}
        </head>
        <body>
        {{ plot_div }}
        {{ plot_script }}
        </body>
    </html>
    """)

    resources = INLINE.render()

    html = template.render(resources=resources,
                           plot_script=script,
                           plot_div=div)
    return html


# convert mpl fig to bokeh
def create_bok_fig(fig):
    p = pn.pane.Matplotlib(fig, dpi=72)
    p = p.get_root()
    return p

# convert bokeh row object to div and scripts for jinja template
def create_layout(p):
    layout = row(p)
    script, div = components(layout)
    return create_html("Ops Clock", script, div)

def create_time_wheel(data):
    fig = plt.figure(figsize=(8,8))
    pie_heatmap(data, vmin=-20,vmax=80,inner_r=0.2)
    p = create_bok_fig(fig)
    html = create_layout(p)
    return html, p

def show_n_nb(p):
    try:
        reset_output()
        output_notebook()
        show(p)
    except:
        output_notebook()
        show(p)

def show_html_plot(data, html_file, show_local=True):
    html, p1 = create_time_wheel(data)
    if show_local:
        show_n_nb(p1)
    with open(html_file,'w') as f:
        f.write(html)
    view(html_file)

show_html_plot(data, 'test.html')

Here is the blank HTML page:

image

Hi @wtaylorb

The JavaScript console of the client browser shows the source of the problem. Here’s the error as reported in Google Chrome.

The Holoviz panel GitHub has a few issues around this error; see for example Panel Issue 1233.

I can get the graphic in your example to render by adding the following lines. I’ve had to use similar workarounds in a server context previously, which is how I primarily use panel.


from bokeh.resources  import settings

settings.resources = 'inline'

NOTE: Your code also includes a variable named row which shadows the import of the bokeh row layout being imported. I changed this also when confirming the fix on my system.

Hope this helps.

1 Like

Hi @wtaylorb

It looks like what you are doing can be simplified and use the api of Panel more over the api of Bokeh.

import calendar

import matplotlib as mpl
import matplotlib.cm as cm
import matplotlib.pyplot as plt
import numpy as np
import pandas as pd
import panel as pn
from bokeh.resources import INLINE

# generate the table with timestamps
np.random.seed(1)
times = pd.Series(
    pd.to_datetime("Nov 1 '16 at 0:42")
    + pd.to_timedelta(np.random.rand(10000) * 60 * 24 * 40, unit="m")
)
# generate counts of each (weekday, hour)
data = pd.crosstab(times.dt.weekday, times.dt.hour.apply(lambda x: "{:02d}:00".format(x))).fillna(0)
data.index = [calendar.day_name[i][0:3] for i in data.index]


def pie_heatmap(table, cmap=cm.hot, vmin=None, vmax=None, inner_r=0.25, pie_args={}):
    n, m = table.shape
    vmin = table.min().min() if vmin is None else vmin
    vmax = table.max().max() if vmax is None else vmax

    centre_circle = plt.Circle(
        (0, 0), inner_r, edgecolor="black", facecolor="white", fill=True, linewidth=0.25
    )
    plt.gcf().gca().add_artist(centre_circle)
    norm = mpl.colors.Normalize(vmin=vmin, vmax=vmax)
    cmapper = cm.ScalarMappable(norm=norm, cmap=cmap)
    for i, (row_name, row) in enumerate(table.iterrows()):
        labels = None if i > 0 else table.columns
        wedges = plt.pie(
            [1] * m,
            radius=inner_r + float(n - i) / n,
            colors=[cmapper.to_rgba(x) for x in row.values],
            labels=labels,
            startangle=90,
            counterclock=False,
            wedgeprops={"linewidth": -1},
            **pie_args
        )
        plt.setp(wedges[0], edgecolor="white", linewidth=1.5)
        wedges = plt.pie(
            [1],
            radius=inner_r + float(n - i - 1) / n,
            colors=["w"],
            labels=[row_name],
            startangle=-90,
            wedgeprops={"linewidth": 0},
        )
        plt.setp(wedges[0], edgecolor="white", linewidth=1.5)
    plt.switch_backend("Agg")


def create_time_wheel(data):
    fig = plt.figure(figsize=(8, 8))
    pie_heatmap(data, vmin=-20, vmax=80, inner_r=0.2)
    plot = pn.pane.Matplotlib(fig, dpi=72)
    return pn.Column("Ops Clock", plot)


layout = create_time_wheel(data)
layout.save(filename="output.html", resources=INLINE)

# layout.servable()
# layout.show()
2 Likes

Very helpful. Thanks!

1 Like

The documentation for save can be found here Deploy and Export — Panel 0.12.4 documentation @wtaylorb .

1 Like