Panel serve deployment is frequently broken and cannot serve more than one user at the same time

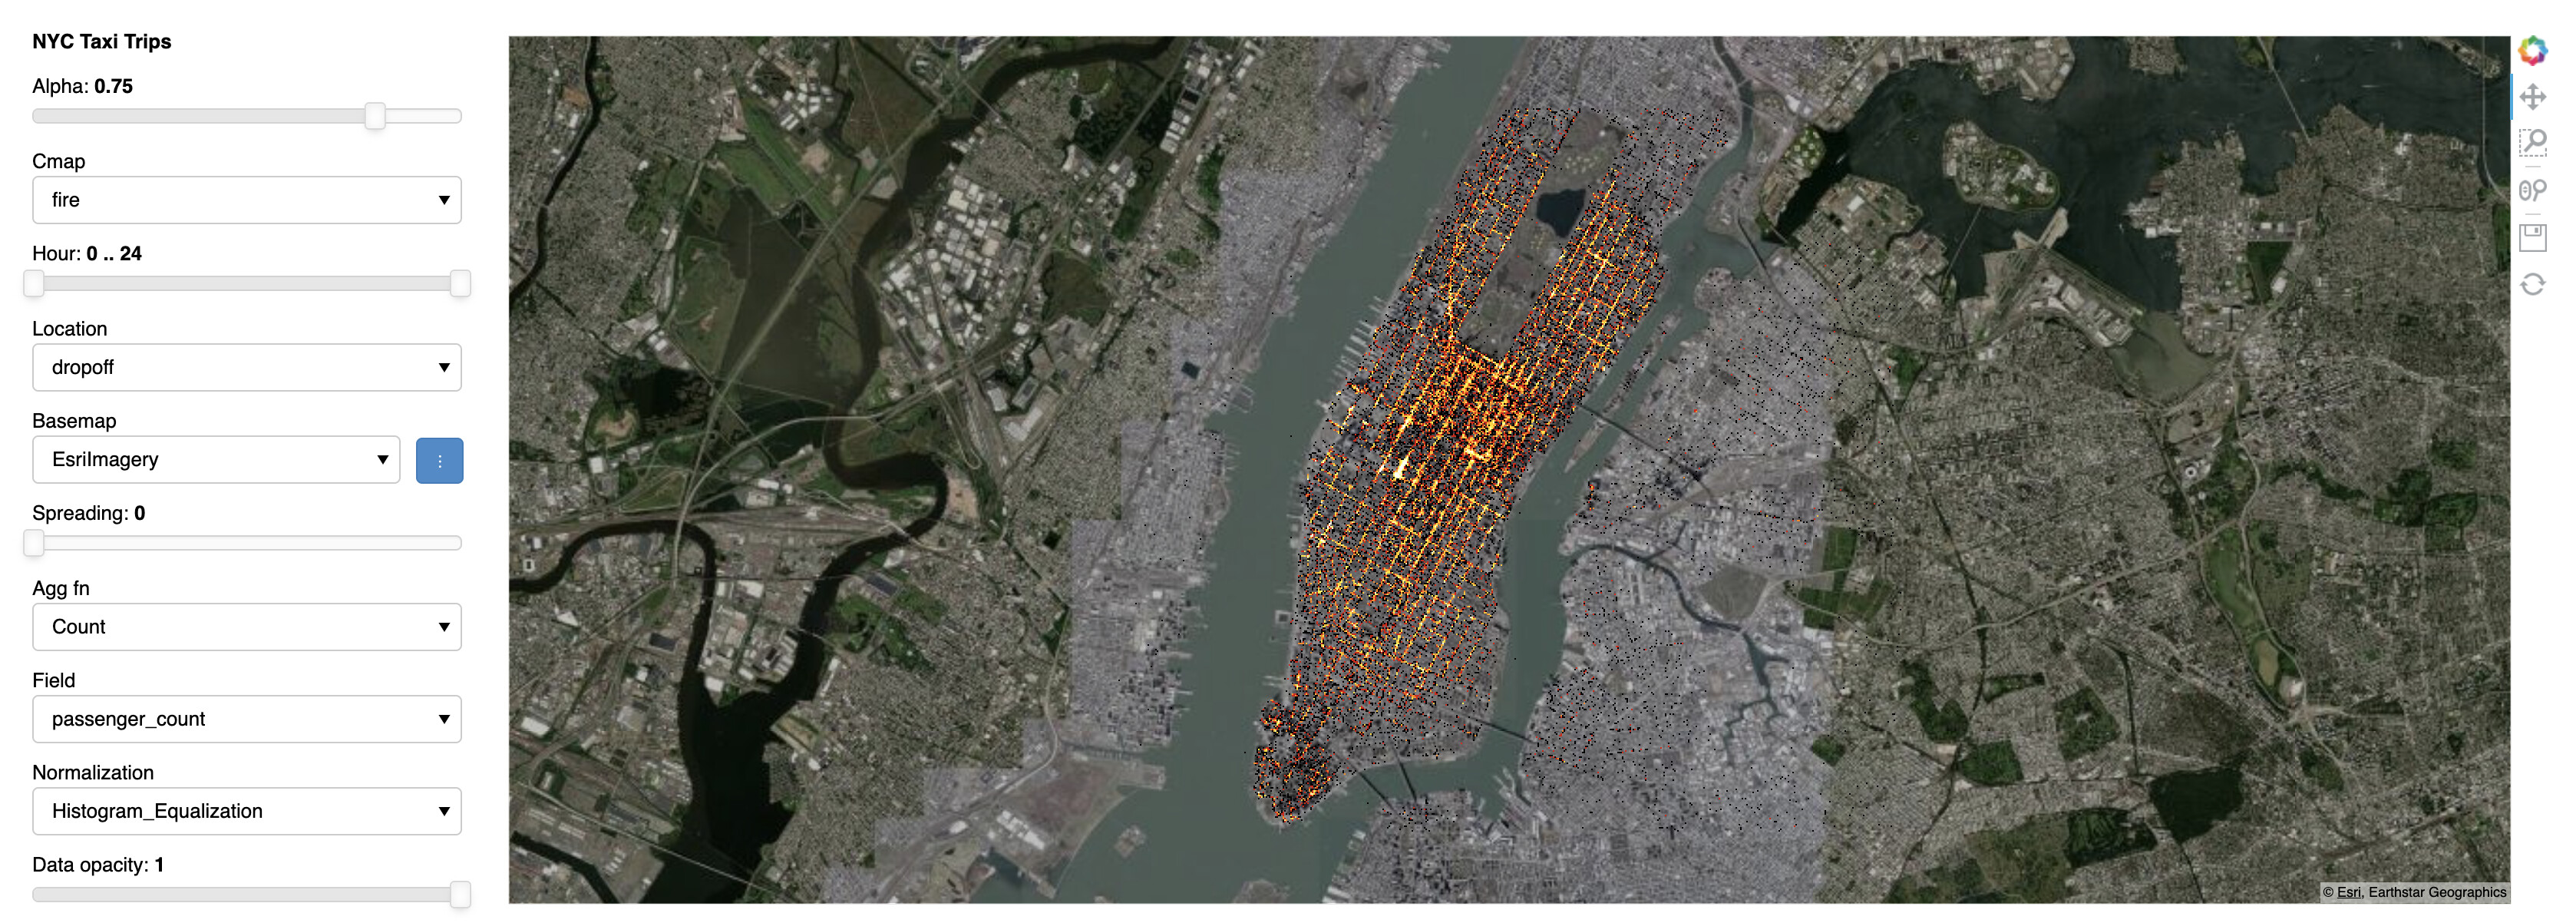
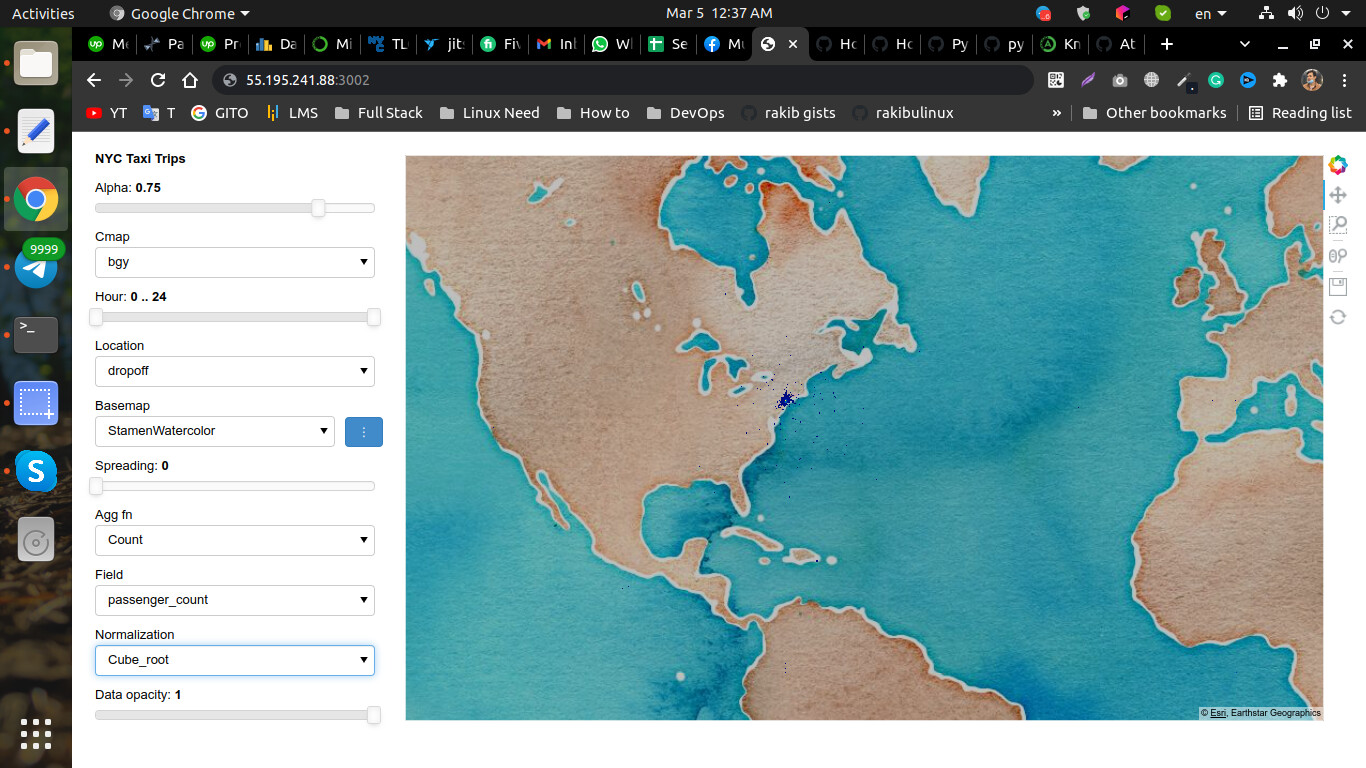
I am developing a map by using panel, bokeh, datashader and holoviews. When I run it with the following command it can be usable by only one user for some time:

panel serve --show --port 5009 touristRouteTurkeyV2.py

and for keeping it long-running

nohup panel serve --show --port 5009 touristRouteTurkeyV2.py &

in both cases, after using a couple of minutes I see the following error and map freezes. And the following error message is represented:

Traceback (most recent call last):
  File "/home/username/anaconda3/envs/py37/lib/python3.7/site-packages/tornado/web.py", line 1704, in _execute
    result = await result
  File "/home/username/anaconda3/envs/py37/lib/python3.7/site-packages/panel/io/server.py", line 214, in get
    session = await self.get_session()
  File "/home/username/anaconda3/envs/py37/lib/python3.7/site-packages/bokeh/server/views/session_handler.py", line 144, in get_session
    session = await self.application_context.create_session_if_needed(session_id, self.request, token)
  File "/home/username/anaconda3/envs/py37/lib/python3.7/site-packages/bokeh/server/contexts.py", line 243, in create_session_if_needed
    self._application.initialize_document(doc)
  File "/home/username/anaconda3/envs/py37/lib/python3.7/site-packages/panel/io/server.py", line 173, in initialize_document
    super().initialize_document(doc)
  File "/home/username/anaconda3/envs/py37/lib/python3.7/site-packages/bokeh/application/application.py", line 194, in initialize_document
    h.modify_document(doc)
  File "/home/username/anaconda3/envs/py37/lib/python3.7/site-packages/bokeh/application/handlers/function.py", line 143, in modify_document
    self._func(doc)
  File "/home/username/anaconda3/envs/py37/lib/python3.7/site-packages/panel/io/server.py", line 78, in _eval_panel
    panel = panel()
  File "/home/username/turkey/touristRouteTurkeyV2.py", line 79, in run
    taxi = NYCTaxiExplorer(name="NYC Taxi Trips")
NameError: name 'NYCTaxiExplorer' is not defined

BOKEH_ALLOW_WS_ORIGIN environment variable is already set to the IP address which we are using to serve and the localhost. That way the project runs initially.

The source code I am trying to run is here:

import holoviews as hv, param, pandas as pd
import panel as pn
import numpy as np
import bokeh

from colorcet import cm
import colorcet
import datashader as ds
from holoviews.operation.datashader import rasterize, shade, spread
from holoviews.element.tiles import StamenTerrain
from holoviews.util.transform import lon_lat_to_easting_northing
from datashader.utils import lnglat_to_meters
from holoviews.element import tiles as hvts
from collections import OrderedDict as odict

hv.extension('bokeh', logo=False)


class NYCTaxiExplorer(param.Parameterized):

    usecols = ['konum_x','konum_y','hour',"countryOrigin","il"]
    df=pd.read_parquet("yabanciKayitlarIlBilgili.parquet")
    koordinatDonusum = lon_lat_to_easting_northing(df["longitude"],df["latitude"])
    df["konum_x"], df["konum_y"] = koordinatDonusum[0], koordinatDonusum[1] 
    df["hour"] = df.time.str[0:2]
    df = df[usecols]

    countries = df.groupby("countryOrigin")["hour"].count().sort_values(ascending=False).reset_index().iloc[0:10].countryOrigin.values.tolist()
    fields= odict([("il","il")])
    opts = dict(width=1000,height=600,xaxis=None,yaxis=None,bgcolor='black',show_grid=False)
    cmaps = ['fire','bgy','bgyw','bmy','gray','kbc']
    maps   = ['EsriImagery', 'EsriUSATopo', 'EsriTerrain', 'CartoMidnight', 'StamenWatercolor', 'StamenTonerBackground']
    bases  = odict([(name, getattr(hvts, name)().relabel(name)) for name in maps])
    gopts  = hv.opts.Tiles(responsive=True, xaxis=None, yaxis=None, bgcolor='black', show_grid=False)
    aggfns = odict([(f.capitalize(),getattr(ds,f)) for f in ['count','sum','min','max','mean','var','std']])
    norms  = odict(Histogram_Equalization='eq_hist', Linear='linear', Log='log', Cube_root='cbrt')
    ulkeler    = param.ObjectSelector("USA", objects={c:c for c in countries})
    alpha      = param.Magnitude(default=0.75, doc="Alpha value for the map opacity")
    cmap       = param.ObjectSelector(colorcet.palette['fire'], objects={c:colorcet.palette[c] for c in cmaps})
    hour       = param.Range(default=(0, 24), bounds=(0, 24))
    basemap    = param.Selector(bases)
    spreading  = param.Integer(0, bounds=(0, 5))
    agg_fn     = param.Selector(aggfns)
    field      = param.Selector(fields)
    normalization = param.Selector(norms)
    data_opacity  = param.Magnitude(1.00)


    @param.depends('alpha', 'basemap')
    def tiles(self):
        return self.basemap.opts(self.gopts).opts(alpha=self.alpha)

    @param.depends('field', 'agg_fn')
    def aggregator(self):
        #field = None if self.field == "counts" else self.field
        field = None
        return self.agg_fn(field)

    @param.depends('ulkeler','hour')
    def points(self):
        points = hv.Points(self.df.query(" countryOrigin == @self.ulkeler "), kdims=['konum_x', 'konum_y'], vdims=['il','hour'])
        if self.hour != (0, 24): points = points.select(hour=self.hour)
        return points

    def viewable(self,**kwargs):
        rasterized = rasterize(hv.DynamicMap(self.points), aggregator=self.aggregator, width=800, height=400)
        shaded     = shade(rasterized, cmap=self.param.cmap, normalization=self.param.normalization)
        spreaded   = spread(shaded, px=self.param.spreading, how="add")
        dataplot   = spreaded.apply.opts(alpha=self.param.data_opacity, show_legend=False)
        
        return hv.DynamicMap(self.tiles) * dataplot 

def run():

    taxi = NYCTaxiExplorer(name="NYC Taxi Trips")
    s=pn.Row(taxi.param, taxi.viewable())
    return s

pn.serve(run,port=3000)

Will have to investigate further but is there any particular reason you’re opting to use pn.serve over starting the server from the commandline with panel serve? All you have to change is:

taxi = NYCTaxiExplorer(name="NYC Taxi Trips")
s = pn.Row(taxi.param, taxi.viewable())
s.servable()

Oh right, I just noticed you are invoking it with panel serve so I’m not at all surprised at your errors. You’re starting two separate servers one by using pn.serve and a separate one by launching the script with panel serve. Using pn.serve is only really recommended during development OR when you need to embed a server in a completely separate application.

Does it mean I need to remove this line:

pn.serve(run,port=3000)

After that panel serve command results with blank screen.

Yes, but you also need to mark the components that you want to display in the app as servable as I did in my code above:

taxi = NYCTaxiExplorer(name="NYC Taxi Trips")
s = pn.Row(taxi.param, taxi.viewable())
s.servable()

Probably I changed my code as you purposed but I am still facing a blank screen, unfortunately.
Also, I am not able to specify which port it will be served. It uses the Tornado default on 5006.

This is my final code:

import holoviews as hv, param, pandas as pd
import panel as pn
import numpy as np
import bokeh

from colorcet import cm
import colorcet
import datashader as ds
from holoviews.operation.datashader import rasterize, shade, spread
from holoviews.element.tiles import StamenTerrain
from holoviews.util.transform import lon_lat_to_easting_northing
from datashader.utils import lnglat_to_meters
from holoviews.element import tiles as hvts
from collections import OrderedDict as odict

hv.extension('bokeh', logo=False)


class NYCTaxiExplorer(param.Parameterized):

    usecols = ['konum_x','konum_y','hour',"countryOrigin","il"]
    df=pd.read_parquet("yabanciKayitlarIlBilgili.parquet")
    koordinatDonusum = lon_lat_to_easting_northing(df["longitude"],df["latitude"])
    df["konum_x"], df["konum_y"] = koordinatDonusum[0], koordinatDonusum[1] 
    df["hour"] = df.time.str[0:2]
    df = df[usecols]

    countries = df.groupby("countryOrigin")["hour"].count().sort_values(ascending=False).reset_index().iloc[0:10].countryOrigin.values.tolist()
    fields= odict([("il","il")])
    opts = dict(width=1000,height=600,xaxis=None,yaxis=None,bgcolor='black',show_grid=False)
    cmaps = ['fire','bgy','bgyw','bmy','gray','kbc']
    maps   = ['EsriImagery', 'EsriUSATopo', 'EsriTerrain', 'CartoMidnight', 'StamenWatercolor', 'StamenTonerBackground']
    bases  = odict([(name, getattr(hvts, name)().relabel(name)) for name in maps])
    gopts  = hv.opts.Tiles(responsive=True, xaxis=None, yaxis=None, bgcolor='black', show_grid=False)
    aggfns = odict([(f.capitalize(),getattr(ds,f)) for f in ['count','sum','min','max','mean','var','std']])
    norms  = odict(Histogram_Equalization='eq_hist', Linear='linear', Log='log', Cube_root='cbrt')
    ulkeler    = param.ObjectSelector("USA", objects={c:c for c in countries})
    alpha      = param.Magnitude(default=0.75, doc="Alpha value for the map opacity")
    cmap       = param.ObjectSelector(colorcet.palette['fire'], objects={c:colorcet.palette[c] for c in cmaps})
    hour       = param.Range(default=(0, 24), bounds=(0, 24))
    basemap    = param.Selector(bases)
    spreading  = param.Integer(0, bounds=(0, 5))
    agg_fn     = param.Selector(aggfns)
    field      = param.Selector(fields)
    normalization = param.Selector(norms)
    data_opacity  = param.Magnitude(1.00)


    @param.depends('alpha', 'basemap')
    def tiles(self):
        return self.basemap.opts(self.gopts).opts(alpha=self.alpha)

    @param.depends('field', 'agg_fn')
    def aggregator(self):
        #field = None if self.field == "counts" else self.field
        field = None
        return self.agg_fn(field)

    @param.depends('ulkeler','hour')
    def points(self):
        points = hv.Points(self.df.query(" countryOrigin == @self.ulkeler "), kdims=['konum_x', 'konum_y'], vdims=['il','hour'])
        if self.hour != (0, 24): points = points.select(hour=self.hour)
        return points

    def viewable(self,**kwargs):
        rasterized = rasterize(hv.DynamicMap(self.points), aggregator=self.aggregator, width=800, height=400)
        shaded     = shade(rasterized, cmap=self.param.cmap, normalization=self.param.normalization)
        spreaded   = spread(shaded, px=self.param.spreading, how="add")
        dataplot   = spreaded.apply.opts(alpha=self.param.data_opacity, show_legend=False)
        
        return hv.DynamicMap(self.tiles) * dataplot 

def run():

    taxi = NYCTaxiExplorer(name="NYC Taxi Trips")
    s=pn.Row(taxi.param, taxi.viewable())
    s.servable()
    # return s

# pn.serve(run,port=3000)

Do not wrap it in the run function.

My latest code is:

import holoviews as hv, param, pandas as pd
import panel as pn
import numpy as np
import bokeh

from colorcet import cm
import colorcet
import datashader as ds
from holoviews.operation.datashader import rasterize, shade, spread
from holoviews.element.tiles import StamenTerrain
from holoviews.util.transform import lon_lat_to_easting_northing
from datashader.utils import lnglat_to_meters
from holoviews.element import tiles as hvts
from collections import OrderedDict as odict

hv.extension('bokeh', logo=False)


class NYCTaxiExplorer(param.Parameterized):

    usecols = ['konum_x','konum_y','hour',"countryOrigin","il"]
    df=pd.read_parquet("yabanciKayitlarIlBilgili.parquet")
    koordinatDonusum = lon_lat_to_easting_northing(df["longitude"],df["latitude"])
    df["konum_x"], df["konum_y"] = koordinatDonusum[0], koordinatDonusum[1] 
    df["hour"] = df.time.str[0:2]
    df = df[usecols]

    countries = df.groupby("countryOrigin")["hour"].count().sort_values(ascending=False).reset_index().iloc[0:10].countryOrigin.values.tolist()
    fields= odict([("il","il")])
    opts = dict(width=1000,height=600,xaxis=None,yaxis=None,bgcolor='black',show_grid=False)
    cmaps = ['fire','bgy','bgyw','bmy','gray','kbc']
    maps   = ['EsriImagery', 'EsriUSATopo', 'EsriTerrain', 'CartoMidnight', 'StamenWatercolor', 'StamenTonerBackground']
    bases  = odict([(name, getattr(hvts, name)().relabel(name)) for name in maps])
    gopts  = hv.opts.Tiles(responsive=True, xaxis=None, yaxis=None, bgcolor='black', show_grid=False)
    aggfns = odict([(f.capitalize(),getattr(ds,f)) for f in ['count','sum','min','max','mean','var','std']])
    norms  = odict(Histogram_Equalization='eq_hist', Linear='linear', Log='log', Cube_root='cbrt')
    ulkeler    = param.ObjectSelector("USA", objects={c:c for c in countries})
    alpha      = param.Magnitude(default=0.75, doc="Alpha value for the map opacity")
    cmap       = param.ObjectSelector(colorcet.palette['fire'], objects={c:colorcet.palette[c] for c in cmaps})
    hour       = param.Range(default=(0, 24), bounds=(0, 24))
    basemap    = param.Selector(bases)
    spreading  = param.Integer(0, bounds=(0, 5))
    agg_fn     = param.Selector(aggfns)
    field      = param.Selector(fields)
    normalization = param.Selector(norms)
    data_opacity  = param.Magnitude(1.00)


    @param.depends('alpha', 'basemap')
    def tiles(self):
        return self.basemap.opts(self.gopts).opts(alpha=self.alpha)

    @param.depends('field', 'agg_fn')
    def aggregator(self):
        #field = None if self.field == "counts" else self.field
        field = None
        return self.agg_fn(field)

    @param.depends('ulkeler','hour')
    def points(self):
        points = hv.Points(self.df.query(" countryOrigin == @self.ulkeler "), kdims=['konum_x', 'konum_y'], vdims=['il','hour'])
        if self.hour != (0, 24): points = points.select(hour=self.hour)
        return points

    def viewable(self,**kwargs):
        rasterized = rasterize(hv.DynamicMap(self.points), aggregator=self.aggregator, width=800, height=400)
        shaded     = shade(rasterized, cmap=self.param.cmap, normalization=self.param.normalization)
        spreaded   = spread(shaded, px=self.param.spreading, how="add")
        dataplot   = spreaded.apply.opts(alpha=self.param.data_opacity, show_legend=False)
        
        return hv.DynamicMap(self.tiles) * dataplot 


taxi = NYCTaxiExplorer(name="NYC Taxi Trips")
s=pn.Row(taxi.param, taxi.viewable())
s.servable()

and I am running it with this command:

panel serve --show --port 5009 touristRouteTurkeyV2.py

Result is white blank screen on: http://localhost:5009/touristRouteTurkeyV2

and web console of this page says:

[bokeh] Lost websocket 0 connection, 1001 () bokeh.min.js:587:4014
[bokeh] Websocket connection 0 disconnected, will not attempt to reconnect bokeh.min.js:587:1888

Hmm, that is very odd. Not sure why the websocket is dropping. Will try shortly and get back to you.

Let me add a little more information about this topic:

Even though I try to run it with nohup whenever I close the terminal the process dies couple of minutes later. I would find it normal if it stops immediately. Maybe nohup is not able to keep it alive.

In addition to that I have a similar but slightly different example which I am experiencing exactly the same problem:

import holoviews as hv, param, pandas as pd
import panel as pn
import numpy as np
import bokeh

from colorcet import cm
import colorcet
import datashader as ds
from holoviews.operation.datashader import rasterize, shade, spread
from holoviews.element.tiles import StamenTerrain
from holoviews.util.transform import lon_lat_to_easting_northing
from datashader.utils import lnglat_to_meters
from holoviews.element import tiles as hvts
from collections import OrderedDict as odict


hv.extension('bokeh', logo=False)


class NYCTaxiExplorer(param.Parameterized):

    usecols = ['dropoff_x','dropoff_y','pickup_x','pickup_y','dropoff_hour','pickup_hour','passenger_count']
    df=pd.read_csv("taxi2016.csv")
    koordinatDonusum = lon_lat_to_easting_northing(df["dropoff_longitude"],df["dropoff_latitude"])

    df["dropoff_x"], df["dropoff_y"] = koordinatDonusum[0], koordinatDonusum[1] 
    koordinatDonusum = lon_lat_to_easting_northing(df["pickup_longitude"],df["pickup_latitude"])
    df["pickup_x"], df["pickup_y"] = koordinatDonusum[0], koordinatDonusum[1] 

    ##df.rename(columns={"dropoff_longitude":"dropoff_x","dropoff_latitude":"dropoff_y","pickup_longitude":"pickup_x","pickup_latitude":"pickup_y"},inplace=True)
    df["pickup_hour"] = pd.to_datetime(np.array(df["tpep_pickup_datetime"].values,dtype=np.datetime64)).hour.tolist()
    df["dropoff_hour"] = pd.to_datetime(np.array(df["tpep_dropoff_datetime"].values,dtype=np.datetime64)).hour.tolist()
    df = df[usecols]

    fields= odict([("passenger_count","passenger_count")])
    opts = dict(width=1000,height=600,xaxis=None,yaxis=None,bgcolor='black',show_grid=False)
    cmaps = ['fire','bgy','bgyw','bmy','gray','kbc']
    maps   = ['EsriImagery', 'EsriUSATopo', 'EsriTerrain', 'CartoMidnight', 'StamenWatercolor', 'StamenTonerBackground']
    bases  = odict([(name, getattr(hvts, name)().relabel(name)) for name in maps])
    gopts  = hv.opts.Tiles(responsive=True, xaxis=None, yaxis=None, bgcolor='black', show_grid=False)
    aggfns = odict([(f.capitalize(),getattr(ds,f)) for f in ['count','sum','min','max','mean','var','std']])
    norms  = odict(Histogram_Equalization='eq_hist', Linear='linear', Log='log', Cube_root='cbrt')
    alpha      = param.Magnitude(default=0.75, doc="Alpha value for the map opacity")
    cmap       = param.ObjectSelector(colorcet.palette['fire'], objects={c:colorcet.palette[c] for c in cmaps})
    hour       = param.Range(default=(0, 24), bounds=(0, 24))
    location   = param.ObjectSelector(default='dropoff', objects=['dropoff', 'pickup'])
    basemap    = param.Selector(bases)
    spreading  = param.Integer(0, bounds=(0, 5))
    agg_fn     = param.Selector(aggfns)
    field      = param.Selector(fields)
    normalization = param.Selector(norms)
    data_opacity  = param.Magnitude(1.00)


    @param.depends('alpha', 'basemap')
    def tiles(self):
        return self.basemap.opts(self.gopts).opts(alpha=self.alpha)

    @param.depends('field', 'agg_fn')
    def aggregator(self):
        field = None if self.field == "counts" else self.field
        return self.agg_fn(field)

    @param.depends('location','hour')
    def points(self):
        points = hv.Points(self.df, kdims=[self.location+'_x', self.location+'_y'], vdims=['dropoff_hour','passenger_count'])
        if self.hour != (0, 24): points = points.select(dropoff_hour=self.hour)
        return points

    def viewable(self,**kwargs):
        rasterized = rasterize(hv.DynamicMap(self.points), aggregator=self.aggregator, width=800, height=400)
        shaded     = shade(rasterized, cmap=self.param.cmap, normalization=self.param.normalization)
        spreaded   = spread(shaded, px=self.param.spreading, how="add")
        dataplot   = spreaded.apply.opts(alpha=self.param.data_opacity, show_legend=False)
        
        return hv.DynamicMap(self.tiles) * dataplot 

taxi = NYCTaxiExplorer(name="NYC Taxi Trips")
s=pn.Row(taxi.param, taxi.viewable())
s.servable()

The file used in the example can be downloaded here: https://storage.googleapis.com/temporary_public_panel_data/taxi2016.csv

1 Like

Have you had a chance to try it?

Just tried it, worked without issues for me:

Thank you. I will try again.

When I try to run it on my local system it works. It even works while I am connected to it with my terminal session but it stops working when I break my connection to the ssh session. I am talking about deploying this project to a remote server and using its public IP and ports.

Hi @philippjfr ;

Is is possible to run two seperate applications in one machine? Because I faced some difficulties. It seems @serkanaltuntas is also encountering similar problems. Panel and Holoviews are perfect tools. We want to create some dashboards. Your help and directions will be highly appreciated.

For myself I’m running two apps on single server without issue. I connect via IP to panel launch pad and then open the available apps on the server from there distinguished by port. They’re non intenssive and have been able to have multiple people use at same time without issues, that said we’re all on the same network that’s failry open internally so nothing else is getting in the way.

Hi, I think this could be a problem with the library version. Could you please share your requirements.txt file or envrionment.yml of your installation?

I also see more stable deployments on Python 3.7.11 and not being able to keep the system running on Python 3.9.10. Could you please let me know your Python version?

The library I have might not be to your needs of course, I essentially at the time installed the latest of everything, can’t recall if I specified python 3.9.5 or if something auto identified requirment for it but that’s the version I have going.

dependencies:
  - anyio=3.5.0=py39hcbf5309_0
  - appdirs=1.4.4=pyhd3eb1b0_0
  - argon2-cffi=21.3.0=pyhd8ed1ab_0
  - argon2-cffi-bindings=21.2.0=py39hb82d6ee_1
  - asttokens=2.0.5=pyhd8ed1ab_0
  - attrs=21.4.0=pyhd8ed1ab_0
  - babel=2.9.1=pyh44b312d_0
  - backcall=0.2.0=pyh9f0ad1d_0
  - backports=1.0=py_2
  - backports.functools_lru_cache=1.6.4=pyhd8ed1ab_0
  - black=22.1.0=pyhd8ed1ab_0
  - blas=1.0=mkl
  - bleach=4.1.0=pyhd3eb1b0_0
  - bokeh=2.4.2=py39haa95532_0
  - bottleneck=1.3.2=py39h7cc1a96_1
  - brotli=1.0.9=ha925a31_2
  - brotlipy=0.7.0=py39h2bbff1b_1003
  - ca-certificates=2021.10.26=haa95532_4
  - certifi=2021.10.8=py39haa95532_2
  - cffi=1.15.0=py39h2bbff1b_1
  - charset-normalizer=2.0.4=pyhd3eb1b0_0
  - click=8.0.3=py39hcbf5309_1
  - cloudpickle=2.0.0=pyhd3eb1b0_0
  - colorama=0.4.4=pyh9f0ad1d_0
  - colorcet=3.0.0=py_0
  - cryptography=36.0.0=py39h21b164f_0
  - cycler=0.11.0=pyhd3eb1b0_0
  - cytoolz=0.11.0=py39h2bbff1b_0
  - dask=2021.10.0=pyhd3eb1b0_0
  - dask-core=2021.10.0=pyhd3eb1b0_0
  - dataclasses=0.8=pyhc8e2a94_3
  - datashader=0.13.0=pyhd3eb1b0_1
  - datashape=0.5.4=py39haa95532_1
  - debugpy=1.5.1=py39h415ef7b_0
  - decorator=5.1.1=pyhd8ed1ab_0
  - defusedxml=0.7.1=pyhd8ed1ab_0
  - distributed=2021.10.0=py39haa95532_0
  - entrypoints=0.3=pyhd8ed1ab_1003
  - executing=0.8.2=pyhd8ed1ab_0
  - flit-core=3.6.0=pyhd8ed1ab_0
  - fonttools=4.25.0=pyhd3eb1b0_0
  - freetype=2.10.4=hd328e21_0
  - fsspec=2022.1.0=pyhd3eb1b0_0
  - heapdict=1.0.1=pyhd3eb1b0_0
  - holoviews=1.14.7=py_0
  - hvplot=0.7.3=py_0
  - icc_rt=2019.0.0=h0cc432a_1
  - icu=58.2=ha925a31_3
  - idna=3.3=pyhd3eb1b0_0
  - importlib-metadata=4.8.2=py39haa95532_0
  - importlib_resources=5.4.0=pyhd8ed1ab_0
  - intel-openmp=2021.4.0=haa95532_3556
  - ipykernel=6.7.0=py39h832f523_0
  - ipython=8.0.1=py39hcbf5309_0
  - ipython_genutils=0.2.0=py_1
  - jedi=0.18.1=py39hcbf5309_0
  - jinja2=3.0.2=pyhd3eb1b0_0
  - jpeg=9d=h2bbff1b_0
  - json5=0.9.5=pyh9f0ad1d_0
  - jsonschema=4.4.0=pyhd8ed1ab_0
  - jupyter_client=7.1.2=pyhd8ed1ab_0
  - jupyter_core=4.9.1=py39hcbf5309_1
  - jupyter_server=1.13.4=pyhd8ed1ab_0
  - jupyterlab=3.2.8=pyhd8ed1ab_0
  - jupyterlab_pygments=0.1.2=pyh9f0ad1d_0
  - jupyterlab_server=2.10.3=pyhd8ed1ab_0
  - kiwisolver=1.3.1=py39hd77b12b_0
  - libpng=1.6.37=h2a8f88b_0
  - libsodium=1.0.18=h8d14728_1
  - libtiff=4.2.0=hd0e1b90_0
  - libwebp=1.2.0=h2bbff1b_0
  - llvmlite=0.37.0=py39h23ce68f_1
  - locket=0.2.1=py39haa95532_1
  - lz4-c=1.9.3=h2bbff1b_1
  - m2w64-gcc-libgfortran=5.3.0=6
  - m2w64-gcc-libs=5.3.0=7
  - m2w64-gcc-libs-core=5.3.0=7
  - m2w64-gmp=6.1.0=2
  - m2w64-libwinpthread-git=5.0.0.4634.697f757=2
  - markdown=3.3.4=py39haa95532_0
  - markupsafe=2.0.1=py39h2bbff1b_0
  - matplotlib=3.5.0=py39haa95532_0
  - matplotlib-base=3.5.0=py39h6214cd6_0
  - matplotlib-inline=0.1.3=pyhd8ed1ab_0
  - mistune=0.8.4=py39hb82d6ee_1005
  - mkl=2021.4.0=haa95532_640
  - mkl-service=2.4.0=py39h2bbff1b_0
  - mkl_fft=1.3.1=py39h277e83a_0
  - mkl_random=1.2.2=py39hf11a4ad_0
  - msgpack-python=1.0.2=py39h59b6b97_1
  - msys2-conda-epoch=20160418=1
  - multipledispatch=0.6.0=py39haa95532_0
  - munkres=1.1.4=py_0
  - mypy_extensions=0.4.3=py39hcbf5309_4
  - nbclassic=0.3.5=pyhd8ed1ab_0
  - nbclient=0.5.10=pyhd8ed1ab_1
  - nbconvert=6.4.1=py39hcbf5309_0
  - nbformat=5.1.3=pyhd8ed1ab_0
  - nest-asyncio=1.5.4=pyhd8ed1ab_0
  - nodejs=17.4.0=h57928b3_0
  - notebook=6.4.8=pyha770c72_0
  - numba=0.54.1=py39hf11a4ad_0
  - numexpr=2.8.1=py39hb80d3ca_0
  - numpy=1.20.3=py39ha4e8547_0
  - numpy-base=1.20.3=py39hc2deb75_0
  - olefile=0.46=pyhd3eb1b0_0
  - openssl=1.1.1m=h2bbff1b_0
  - packaging=21.3=pyhd3eb1b0_0
  - pandas=1.3.5=py39h6214cd6_0
  - pandoc=2.17.1.1=h57928b3_0
  - pandocfilters=1.5.0=pyhd8ed1ab_0
  - panel=0.12.6=py_0
  - param=1.12.0=py_0
  - parso=0.8.3=pyhd8ed1ab_0
  - partd=1.2.0=pyhd3eb1b0_0
  - pathspec=0.9.0=pyhd8ed1ab_0
  - pickleshare=0.7.5=py_1003
  - pillow=8.4.0=py39hd45dc43_0
  - pip=21.2.4=py39haa95532_0
  - platformdirs=2.3.0=pyhd8ed1ab_0
  - pooch=1.4.0=pyhd3eb1b0_0
  - prometheus_client=0.13.1=pyhd8ed1ab_0
  - prompt-toolkit=3.0.26=pyha770c72_0
  - psutil=5.8.0=py39h2bbff1b_1
  - pure_eval=0.2.2=pyhd8ed1ab_0
  - pycparser=2.21=pyhd3eb1b0_0
  - pyct=0.4.8=py_0
  - pyct-core=0.4.8=py_0
  - pygments=2.11.2=pyhd8ed1ab_0
  - pyopenssl=21.0.0=pyhd3eb1b0_1
  - pyparsing=3.0.4=pyhd3eb1b0_0
  - pyqt=5.9.2=py39hd77b12b_6
  - pyrsistent=0.18.1=py39hb82d6ee_0
  - pysocks=1.7.1=py39haa95532_0
  - python=3.9.5=h6244533_3
  - python-dateutil=2.8.2=pyhd8ed1ab_0
  - python_abi=3.9=2_cp39
  - pytz=2021.3=pyhd8ed1ab_0
  - pyviz_comms=2.1.0=py_0
  - pywin32=303=py39hb82d6ee_0
  - pywinpty=0.5.7=py39haa95532_0
  - pyyaml=6.0=py39h2bbff1b_1
  - pyzmq=22.3.0=py39he46f08e_1
  - qt=5.9.7=vc14h73c81de_0
  - requests=2.27.1=pyhd3eb1b0_0
  - scipy=1.7.3=py39h0a974cb_0
  - send2trash=1.8.0=pyhd8ed1ab_0
  - setuptools=58.0.4=py39haa95532_0
  - sip=4.19.13=py39hd77b12b_0
  - six=1.16.0=pyhd3eb1b0_0
  - sniffio=1.2.0=py39hcbf5309_2
  - sortedcontainers=2.4.0=pyhd3eb1b0_0
  - sqlite=3.37.0=h2bbff1b_0
  - stack_data=0.1.4=pyhd8ed1ab_0
  - tbb=2021.5.0=h59b6b97_0
  - tblib=1.7.0=pyhd3eb1b0_0
  - terminado=0.9.4=py39haa95532_0
  - testpath=0.5.0=pyhd8ed1ab_0
  - tk=8.6.11=h2bbff1b_0
  - tomli=2.0.0=pyhd8ed1ab_1
  - toolz=0.11.2=pyhd3eb1b0_0
  - tornado=6.1=py39h2bbff1b_0
  - tqdm=4.62.3=pyhd3eb1b0_1
  - traitlets=5.1.1=pyhd8ed1ab_0
  - typed-ast=1.5.2=py39hb82d6ee_0
  - typing-extensions=3.10.0.2=hd3eb1b0_0
  - typing_extensions=3.10.0.2=pyh06a4308_0
  - tzdata=2021e=hda174b7_0
  - urllib3=1.26.8=pyhd3eb1b0_0
  - vc=14.2=h21ff451_1
  - vs2015_runtime=14.27.29016=h5e58377_2
  - wcwidth=0.2.5=pyh9f0ad1d_2
  - webencodings=0.5.1=py39haa95532_1
  - websocket-client=1.2.3=pyhd8ed1ab_0
  - wheel=0.37.1=pyhd3eb1b0_0
  - win_inet_pton=1.1.0=py39haa95532_0
  - wincertstore=0.2=py39haa95532_2
  - winpty=0.4.3=4
  - xarray=0.20.1=pyhd3eb1b0_1
  - xz=5.2.5=h62dcd97_0
  - yaml=0.2.5=he774522_0
  - zeromq=4.3.4=h0e60522_1
  - zict=2.0.0=pyhd3eb1b0_0
  - zipp=3.7.0=pyhd3eb1b0_0
  - zlib=1.2.11=h8cc25b3_4
  - zstd=1.4.9=h19a0ad4_0

Hi Carl;

Is is possible to test NYCTaxi application? As this application is memory and cpu intensive, it can trigger some problem. Maybe you can create two different applications from same code. I wonder whether these two applications will be able to keep running when different users run queries in these applications.

Thanks.

Hi, @philippjfr, do you know why I am getting 500: Internal Server Error for my project? Please check the log

tornado.application - ERROR - Uncaught exception GET / (23.147.204.321)
HTTPServerRequest(protocol=‘http’, host=‘55.195.241.88:3002’, method=‘GET’, uri=’/’, version=‘HTTP/1.1’, remote_ip=‘23.147.204.321’)
Traceback (most recent call last):
File “/root/miniconda3/lib/python3.7/site-packages/tornado/web.py”, line 1704, in _execute
result = await result
File “/root/miniconda3/lib/python3.7/site-packages/panel/io/server.py”, line 214, in get
session = await self.get_session()
File “/root/miniconda3/lib/python3.7/site-packages/bokeh/server/views/session_handler.py”, line 144, in get_session
session = await self.application_context.create_session_if_needed(session_id, self.request, token)
File “/root/miniconda3/lib/python3.7/site-packages/bokeh/server/contexts.py”, line 243, in create_session_if_needed
self._application.initialize_document(doc)
File “/root/miniconda3/lib/python3.7/site-packages/panel/io/server.py”, line 173, in initialize_document
super().initialize_document(doc)
File “/root/miniconda3/lib/python3.7/site-packages/bokeh/application/application.py”, line 194, in initialize_document
h.modify_document(doc)
File “/root/miniconda3/lib/python3.7/site-packages/bokeh/application/handlers/function.py”, line 143, in modify_document
self._func(doc)
File “/root/miniconda3/lib/python3.7/site-packages/panel/io/server.py”, line 78, in _eval_panel
panel = panel()
File “/home/map/nyc/nyc_taxi_v3.py”, line 90, in run
taxi = NYCTaxiExplorer(name=“NYC Taxi Trips”)
NameError: name ‘NYCTaxiExplorer’ is not defined

I am trying this command to run the project: panel serve nyc_taxi_v3.py

After visiting this URL i can see below log in my terminal: http//55.195.241.88:5006/nyc_taxi_v3

2022-03-04 18:32:34,317 Starting Bokeh server version 2.4.2 (running on Tornado 6.1)
2022-03-04 18:32:34,320 User authentication hooks NOT provided (default user enabled)
2022-03-04 18:32:34,328 Bokeh app running at: http//localhost:5006/nyc_taxi_v3
2022-03-04 18:32:34,328 Starting Bokeh server with process id: 6853
WARNING:param.main: CartoMidnight tile source is deprecated and is likely to be unusable: no longer publicly available.
2022-03-04 18:34:23,013 CartoMidnight tile source is deprecated and is likely to be unusable: no longer publicly available.
Launching server at http//localhost:3002

After sometime later if I reload the URL (http//55.195.241.88:3002) I can see 500: Internal Server Error. Your help will be easy for me to fix it.

You can check the code:

import holoviews as hv, param, pandas as pd
import panel as pn
import numpy as np
import bokeh
import sys

from colorcet import cm
import colorcet
import datashader as ds
from holoviews.operation.datashader import rasterize, shade, spread
from holoviews.element.tiles import StamenTerrain
from holoviews.util.transform import lon_lat_to_easting_northing
from datashader.utils import lnglat_to_meters
from holoviews.element import tiles as hvts
from collections import OrderedDict as odict


hv.extension('bokeh', logo=False)

sys.setrecursionlimit(900000)

class NYCTaxiExplorer(param.Parameterized):

    usecols = ['dropoff_x','dropoff_y','pickup_x','pickup_y','dropoff_hour','pickup_hour','passenger_count']
    df=pd.read_csv("taxi2016.csv")
    koordinatDonusum = lon_lat_to_easting_northing(df["dropoff_longitude"],df["dropoff_latitude"])

    df["dropoff_x"], df["dropoff_y"] = koordinatDonusum[0], koordinatDonusum[1] 
    koordinatDonusum = lon_lat_to_easting_northing(df["pickup_longitude"],df["pickup_latitude"])
    df["pickup_x"], df["pickup_y"] = koordinatDonusum[0], koordinatDonusum[1] 

    ##df.rename(columns={"dropoff_longitude":"dropoff_x","dropoff_latitude":"dropoff_y","pickup_longitude":"pickup_x","pickup_latitude":"pickup_y"},inplace=True)
    df["pickup_hour"] = pd.to_datetime(np.array(df["tpep_pickup_datetime"].values,dtype=np.datetime64)).hour.tolist()
    df["dropoff_hour"] = pd.to_datetime(np.array(df["tpep_dropoff_datetime"].values,dtype=np.datetime64)).hour.tolist()
    df = df[usecols]

    fields= odict([("passenger_count","passenger_count")])
    opts = dict(width=1000,height=600,xaxis=None,yaxis=None,bgcolor='black',show_grid=False)
    cmaps = ['fire','bgy','bgyw','bmy','gray','kbc']
    maps   = ['EsriImagery', 'EsriUSATopo', 'EsriTerrain', 'CartoMidnight', 'StamenWatercolor', 'StamenTonerBackground']
    bases  = odict([(name, getattr(hvts, name)().relabel(name)) for name in maps])
    gopts  = hv.opts.Tiles(responsive=True, xaxis=None, yaxis=None, bgcolor='black', show_grid=False)
    aggfns = odict([(f.capitalize(),getattr(ds,f)) for f in ['count','sum','min','max','mean','var','std']])
    norms  = odict(Histogram_Equalization='eq_hist', Linear='linear', Log='log', Cube_root='cbrt')
    alpha      = param.Magnitude(default=0.75, doc="Alpha value for the map opacity")
    cmap       = param.ObjectSelector(colorcet.palette['fire'], objects={c:colorcet.palette[c] for c in cmaps})
    hour       = param.Range(default=(0, 24), bounds=(0, 24))
    location   = param.ObjectSelector(default='dropoff', objects=['dropoff', 'pickup'])
    basemap    = param.Selector(bases)
    spreading  = param.Integer(0, bounds=(0, 5))
    agg_fn     = param.Selector(aggfns)
    field      = param.Selector(fields)
    normalization = param.Selector(norms)
    data_opacity  = param.Magnitude(1.00)


    @param.depends('alpha', 'basemap')
    def tiles(self):
        return self.basemap.opts(self.gopts).opts(alpha=self.alpha)

    @param.depends('field', 'agg_fn')
    def aggregator(self):
        field = None if self.field == "counts" else self.field
        return self.agg_fn(field)

    @param.depends('location','hour')
    def points(self):
        points = hv.Points(self.df, kdims=[self.location+'_x', self.location+'_y'], vdims=['dropoff_hour','passenger_count'])
        if self.hour != (0, 24): points = points.select(dropoff_hour=self.hour)
        return points

    def viewable(self,**kwargs):
        rasterized = rasterize(hv.DynamicMap(self.points), aggregator=self.aggregator, width=800, height=400)
        shaded     = shade(rasterized, cmap=self.param.cmap, normalization=self.param.normalization)
        spreaded   = spread(shaded, px=self.param.spreading, how="add")
        dataplot   = spreaded.apply.opts(alpha=self.param.data_opacity, show_legend=False)
        
        return hv.DynamicMap(self.tiles) * dataplot 


#taxi = NYCTaxiExplorer(name="NYC Taxi Trips")
#s=pn.Row(taxi.param, taxi.viewable())
#s.servable()


def run():

    taxi = NYCTaxiExplorer(name="NYC Taxi Trips")
    s=pn.Row(taxi.param, taxi.viewable())
    return s

pn.serve(run,port=3002)

Thanks in advance

Please check working picture