'Panel serve' doesn't take plotly backend into account

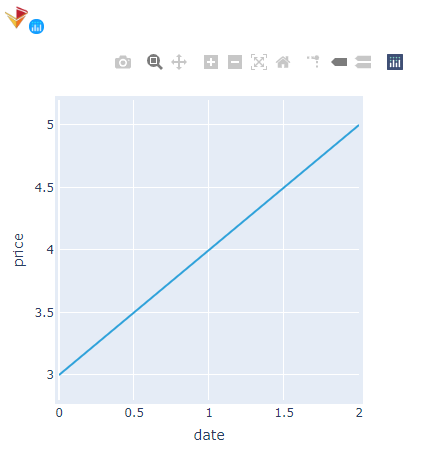
The following code correctly produces a plotly graph within a Jupyter notebook:

import holoviews as hv
import numpy as np
import pandas as pd
import xarray as xr
import panel as pn

hv.extension('plotly')
pn.extension('plotly')

df = pd.DataFrame({"date":[0,1,2],"price":[3,4,5]}).set_index("date")
z = xr.DataArray(df.price,dims=("date"),
             coords={"date":df.index})

k = hv.Curve(z)
p2 = pn.Column(k)
p2.servable()

image

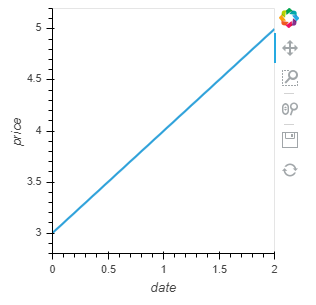
But when trying to serve the app with ‘panel serve’ in the console, the graph is rendered by the bokeh backend:
image

Is there a way to fix this?

Fixed in Panel #1429 and it’ll be in the Panel 0.9.6 release tomorrow. You can also force it explicitly with:

p2 = pn.Column(pn.pane.HoloViews(k, renderer=hv.renderer('plotly')))
1 Like

0.9.6 works for displaying the chart with ‘panel serve’, but now it doesn’t render in Jupyter anymore : /

Well that’s no good, any JS console errors? Could you try clearing the notebook, reloading the page and try again?

1 Like

The latest version of holoviews (1.13.3) /panel (0.9.7) /bokeh (2.1.1) fixed it! : )