Panel works with AnyWidget

I heard that @philippjfr Rudiger and the Bokeh team had made it possible to use AnyWidget in the same way as other Ipywidgets with Panel. But so far I had not seen an example. So here is one.

This example is not the simplest Hello World example. Its a bit more complicated because I wanted to show how to create general functionality to observe all the traits (~parameters) of an AnyWidget and bind to them. This is the create_observer function.


# pip install panel ipywidgets_bokeh anywidget
import anywidget
import traitlets

class CounterWidget(anywidget.AnyWidget):
    _esm = """
    export function render({ model, el }) {
      let getCount = () => model.get("count");
      let button = document.createElement("button");
      button.classList.add("counter-button");
      button.innerHTML = `Count is ${getCount()}`;
      button.addEventListener("click", () => {
        model.set("count", getCount() + 1);
        model.save_changes();
      });
      model.on("change:count", () => {
        button.innerHTML = `Count is ${getCount()}`;
      });
      el.appendChild(button);
    }
    """
    _css="""
    .counter-button { background-color: pink; font-size: 48px}
    .counter-button:hover { background-color: pink; }
    """
    count = traitlets.Int(0).tag(sync=True)

counter = CounterWidget()

# HELP FUNCTIONALITY to convert Traitlets Classes/ Events to Param Classes/ Events

import param

_ipywidget_classes = {}
_any_widget_traits = set(anywidget.AnyWidget().traits())

def create_observer(obj, traits=None)->param.Parameterized:
    """Returns a Parameterized class with parameters corresponding to the traits of the obj
    
    Args:
        traits: A list of traits to observe. If None all traits not on the base AnyWidget will be
        observed.
    """
    if not traits:
        traits = list(set(obj.traits())-_any_widget_traits)
    name = type(obj).__name__
    if name in _ipywidget_classes:
        observer_class = _ipywidget_classes[name]
    else:
        observer_class = param.parameterized_class(name, {trait: param.Parameter() for trait in traits})
        _ipywidget_classes[name] = observer_class
    
    values = {trait: getattr(obj, trait) for trait in traits}
    observer = observer_class(**values)
    obj.observe(lambda event: setattr(observer, event["name"], event["new"]), names=traits)
    return observer

# THE PANEL APP

import panel as pn
pn.extension("ipywidgets")

observer = create_observer(counter)

def some_output(count):
    return f"The count is {count}!"

component = pn.Column(counter, pn.bind(some_output, observer.param.count))

pn.template.FastListTemplate(
    site="Panel",
    title="Works with AnyWidget",
    main=[component],
).servable()
2 Likes

Jupyter-TlDraw


# pip install panel ipywidgets_bokeh tldraw
from tldraw import TldrawWidget

widget = TldrawWidget()

# HELP FUNCTIONALITY to convert Traitlets Classes/ Events to Param Classes/ Events
import anywidget
import param

_ipywidget_classes = {}
_any_widget_traits = set(anywidget.AnyWidget().traits())

def create_observer(obj, traits=None)->param.Parameterized:
    """Returns a Parameterized class with parameters corresponding to the traits of the obj
    
    Args:
        traits: A list of traits to observe. If None all traits not on the base AnyWidget will be
        observed.
    """
    if not traits:
        traits = list(set(obj.traits())-_any_widget_traits)
    print(traits)
    name = type(obj).__name__
    if name in _ipywidget_classes:
        observer_class = _ipywidget_classes[name]
    else:
        observer_class = param.parameterized_class(name, {trait: param.Parameter() for trait in traits})
        _ipywidget_classes[name] = observer_class
    
    values = {trait: getattr(obj, trait) for trait in traits}
    observer = observer_class(**values)
    obj.observe(lambda event: setattr(observer, event["name"], event["new"]), names=traits)
    return observer

# THE PANEL APP

import panel as pn
pn.extension("ipywidgets")

observer = create_observer(widget)

def some_output(value):
    print(value)
    return value

component = pn.Column(widget, pn.bind(some_output, observer.param.value), "**Note**: Jupyter-TlDraw does not support bidirectional communication yet")

pn.template.FastListTemplate(
    site="Panel",
    title="Works with Jupyter-TlDraw",
    main=[component],
).servable()
2 Likes

Mosaic

Mosaic is a framework for linking data visualizations, tables, input widgets, and other data-driven components, while leveraging a database for scalable processing. With Mosaic, you can interactively visualize and explore millions and even billions of data points.

The Mosaic Jupyter Widget | Mosaic (uwdata.github.io) is built on top of AnyWidget and works with Panel


# pip install panel pandas ipywidgets_bokeh mosaic-widget
import pandas as pd
from mosaic_widget import MosaicWidget

weather = pd.read_csv(
    "https://uwdata.github.io/mosaic-datasets/data/seattle-weather.csv",
    parse_dates=["date"],
)

specification = {
    "meta": {
        "title": "Seattle Weather",
        "description": "An interactive view of Seattle’s weather, including maximum temperature, amount of precipitation, and type of weather. By dragging on the scatter plot, you can see the proportion of days in that range that have sun, fog, drizzle, rain, or snow.\n",
        "credit": "Based on a [Vega-Lite/Altair example](https://vega.github.io/vega-lite/examples/interactive_seattle_weather.html) by Jake Vanderplas.",
    },
    "params": {
        "click": {"select": "single"},
        "domain": ["sun", "fog", "drizzle", "rain", "snow"],
        "colors": ["#e7ba52", "#a7a7a7", "#aec7e8", "#1f77b4", "#9467bd"],
    },
    "vconcat": [
        {
            "hconcat": [
                {
                    "plot": [
                        {
                            "mark": "dot",
                            "data": {"from": "weather", "filterBy": "$click"},
                            "x": {"dateMonthDay": "date"},
                            "y": "temp_max",
                            "fill": "weather",
                            "r": "precipitation",
                            "fillOpacity": 0.7,
                        },
                        {
                            "select": "intervalX",
                            "as": "$range",
                            "brush": {"fill": "none", "stroke": "#888"},
                        },
                        {
                            "select": "highlight",
                            "by": "$range",
                            "fill": "#ccc",
                            "fillOpacity": 0.2,
                        },
                        {"legend": "color", "as": "$click", "columns": 1},
                    ],
                    "xyDomain": "Fixed",
                    "xTickFormat": "%b",
                    "colorDomain": "$domain",
                    "colorRange": "$colors",
                    "rDomain": "Fixed",
                    "rRange": [2, 10],
                    "width": 680,
                    "height": 300,
                }
            ]
        },
        {
            "plot": [
                {
                    "mark": "barX",
                    "data": {"from": "weather"},
                    "x": {"count": None},
                    "y": "weather",
                    "fill": "#ccc",
                    "fillOpacity": 0.2,
                },
                {
                    "mark": "barX",
                    "data": {"from": "weather", "filterBy": "$range"},
                    "x": {"count": None},
                    "y": "weather",
                    "fill": "weather",
                    "order": "weather",
                },
                {"select": "toggleY", "as": "$click"},
                {"select": "highlight", "by": "$click"},
            ],
            "xDomain": "Fixed",
            "yDomain": "$domain",
            "yLabel": None,
            "colorDomain": "$domain",
            "colorRange": "$colors",
            "width": 680,
        },
    ],
}
mosaic = MosaicWidget(specification, data={"weather": weather})

# THE PANEL APP

import panel as pn

pn.extension("ipywidgets")

component = pn.panel(mosaic, sizing_mode="stretch_width")

pn.template.FastListTemplate(
    logo="https://panel.holoviz.org/_static/logo_horizontal_dark_theme.png",
    title="Works with MosaicWidget",
    main=[component],
).servable()
2 Likes

lonboard

Check out lonboard


"""Panel data app based on https://developmentseed.org/lonboard/latest/examples/north-america-roads/"""
# pip install panel colorcet ipywidgets_bokeh geopandas palettable lonboard
import colorcet as cc
import geopandas as gpd

from lonboard import Map, PathLayer
from lonboard.colormap import apply_continuous_cmap
from palettable.palette import Palette

import panel as pn

url = "https://naciscdn.org/naturalearth/10m/cultural/ne_10m_roads_north_america.zip"
path = "ne_10m_roads_north_america.zip"

try:
    gdf = pn.state.as_cached(
        "ne_10m_roads_north_america", gpd.read_file, filename=path, engine="pyogrio"
    )
except:
    gdf = pn.state.as_cached(
        "ne_10m_roads_north_america", gpd.read_file, filename=url, engine="pyogrio"
    )

state_options = sorted(state for state in gdf["state"].unique() if state)


def to_rgb(hex: str) -> list:
    h = hex.strip("#")
    return list(int(h[i : i + 2], 16) for i in (0, 2, 4))


def to_palette(cmap) -> Palette:
    """Returns the ColorCet colormap as a palettable Palette"""
    colors = [to_rgb(item) for item in cmap]
    return Palette(name="colorcet", map_type="colorcet", colors=colors)


def create_map(state="California", cmap=cc.fire, alpha=0.8):
    palette = to_palette(cmap)
    data = gdf[gdf["state"] == state]
    layer = PathLayer.from_geopandas(data, width_min_pixels=0.8)
    normalized_scale_rank = (data["scalerank"] - 3) / 9
    layer.get_color = apply_continuous_cmap(normalized_scale_rank, palette, alpha=alpha)
    map_ = Map(layers=[layer], _height=650)
    return map_


description = """# lonboard

A Python library for **fast, interactive geospatial vector data visualization** in Jupyter (and Panel).

By utilizing new technologies like `GeoArrow` and `GeoParquet` in conjunction with GPU-based map rendering, lonboard aims to enable visualizing large geospatial datasets interactively through a simple interface."""


# THE PANEL APP
pn.extension("ipywidgets")
state = pn.widgets.Select(
    value="California",
    options=state_options,
    width=150,
    name="State",
    sizing_mode="stretch_width",
)
cmap = pn.widgets.ColorMap(
    value=cc.fire,
    options=cc.palette,
    ncols=3,
    swatch_width=100,
    name="cmap by Colorcet",
    sizing_mode="stretch_width",
)
alpha = pn.widgets.FloatSlider(
    value=0.8, start=0, end=1, name="Alpha", min_width=100, sizing_mode="stretch_width"
)
logo = pn.pane.Image(
    "https://github.com/developmentseed/lonboard/raw/main/assets/dalle-lonboard.jpg"
)
def title(state):
    return f"# North America Roads: {state}"

settings = pn.Column(state, cmap, alpha)
description = pn.Column(pn.pane.Markdown(description, margin=5), logo)
component = pn.Column(
    pn.bind(title, state=state),
    pn.panel(
        pn.bind(create_map, state=state, cmap=cmap, alpha=alpha.param.value_throttled),
        sizing_mode="stretch_both",
    ),
    sizing_mode="stretch_both",
)
pn.template.FastListTemplate(
    logo="https://panel.holoviz.org/_static/logo_horizontal_dark_theme.png",
    title="Works with LonBoard",
    main=[component],
    sidebar=[description, settings],
).servable()
1 Like

MapWidget | Cesium

Check out Cesium - mapwidget


# pip install panel ipywidgets_bokeh mapwidget
import os

import mapwidget.cesium as mapwidget

import panel as pn

pn.extension("ipywidgets")

try:
    token = os.environ["CESIUM_TOKEN"]
except KeyError as ex:
    raise EnvironmentError(
        "CESIUM_TOKEN environment variable not set. "
        "Sign up for free and get a free Cesium token here https://ion.cesium.com/signup/"
    ) from ex

cesium_map = mapwidget.Map(
    center=[40.70605, -74.01177], height="650px", altitude=600, token=token
)

component = pn.panel(cesium_map, sizing_mode="stretch_width")

description = """# MapWidget

Custom Jupyter widgets for creating interactive 2D/3D maps using popular JavaScript libraries with bidirectional communication, such as `Cesium`, `Mapbox`, `MapLibre`, `Leaflet`, and `OpenLayers`.

By **Qiusheng Wu**

<img src="https://avatars.githubusercontent.com/u/5016453?v=4" style="width:100%;"> 

# Cesium

Cesium is the open platform for software applications designed to unleash the power of 3D data.

<img src="https://images.prismic.io/cesium/a4dc3936-e083-4337-ba48-bb5bba78b2a1_ion_color_white.png" style="width:100%;"> 
"""

pn.template.FastListTemplate(
    logo="https://panel.holoviz.org/_static/logo_horizontal_dark_theme.png",
    title="Works with mapwidget.cesium",
    main=[component],
    sidebar=[description],
).servable()
1 Like

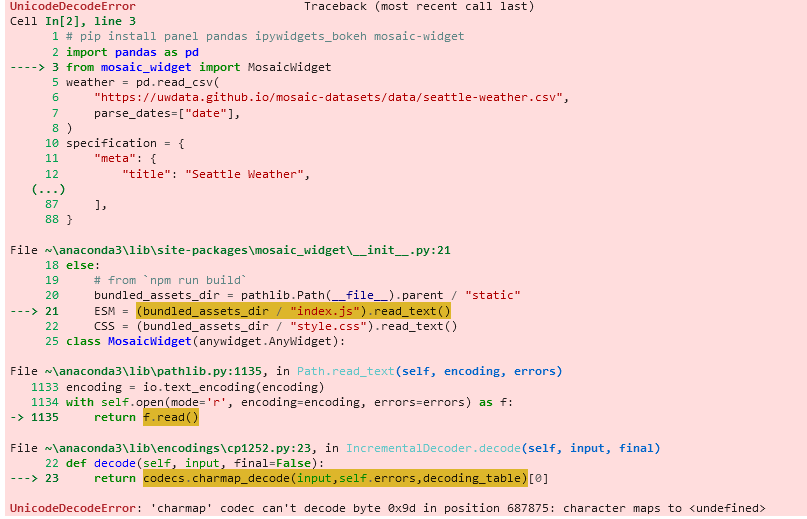
Hi @Marc , awesome !. but I try to run your code unfortunely I got error

did you have any suggestion?
thanks

1 Like

Hi @rh1

To me that looks like a bug in the MosaicWidget. You would get it just by running from mosaic_widget import MosaicWidget. Try reporting the issue in their github.

Hi @Marc thanks. I have install in the other computer and looks like no issue. Probably I will redo installation in my particular problem computer. thanks

1 Like

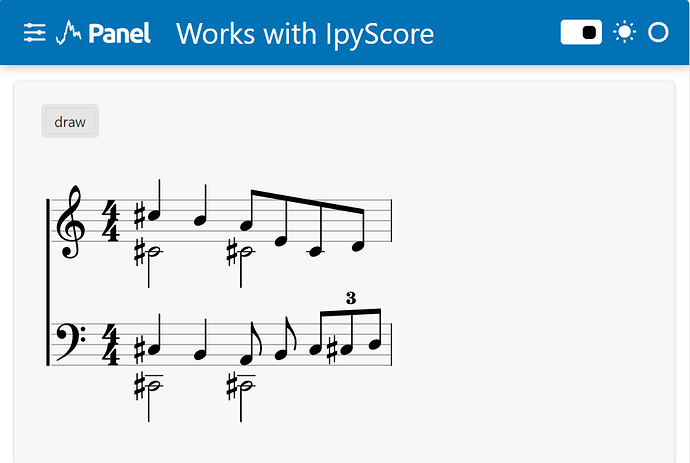
IpyScore

Check out IpyScore. Please note that the IpyScore Widget holds its state in the client/ browser. Thus any scores drawn before the widget is displayed will not be shown. That is why I included the button in the example.

"""Panel data app based on https://github.com/davidbrochart/ipyscore/blob/main/examples/introduction.ipynb"""
# pip install panel ipywidgets_bokeh ipyscore
from ipyscore import Widget

widget = Widget(width=500, height=300)

# THE PANEL APP
import panel as pn

pn.extension("ipywidgets")

component = pn.Column(
    pn.pane.IPyWidget(widget, sizing_mode="stretch_both"),
    sizing_mode="stretch_both",
)

def draw(_=None):
    score = widget.new_score()
    system = widget.new_system()

    voices = [
        score.voice(
            score.notes("C#5/q, B4", stem="up").concat(
                score.beam(score.notes("A4/8, E4, C4, D4", stem="up"))
            )
        ),
        score.voice(
            score.notes("C#4/h, C#4", stem="down")
        ),
    ]

    system.add_stave(voices=voices).add_clef("treble").add_time_signature("4/4")

    voices = [
        score.voice(
            score.notes("C#3/q, B2, A2/8, B2", clef="bass", stem="up").concat(
                score.tuplet(score.beam(score.notes("C3/8, C#3, D3", clef="bass", stem="up")))
            )
        ),
        score.voice(
            score.notes("C#2/h, C#2", clef="bass", stem="down")
        ),
    ]

    system.add_stave(voices=voices).add_clef("bass").add_time_signature("4/4")
    system.add_connector()
    widget.draw()

draw_button = pn.widgets.Button(name="draw", on_click=draw)
pn.template.FastListTemplate(
    logo="https://panel.holoviz.org/_static/logo_horizontal_dark_theme.png",
    title="Works with IpyScore",
    main=[pn.Column(draw_button, component)],
).servable()
1 Like

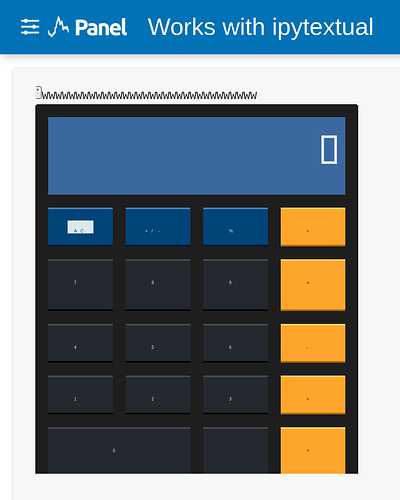
I also tried ipytextual, which seems to work fine.

# pip install panel ipywidgets_bokeh ipytextual
from decimal import Decimal

from ipytextual import Widget, Driver
from textual import events, on
from textual.app import App, ComposeResult
from textual.containers import Container
from textual.css.query import NoMatches
from textual.reactive import var
from textual.widgets import Button, Digits

class CalculatorApp(App):
    """A working 'desktop' calculator."""

    CSS = """
    Screen {
        overflow: auto;
    }

    #calculator {
        layout: grid;
        grid-size: 4;
        grid-gutter: 1 2;
        grid-columns: 1fr;
        grid-rows: 2fr 1fr 1fr 1fr 1fr 1fr;
        margin: 1 2;
        min-height: 25;
        min-width: 26;
        height: 100%;
    }

    Button {
        width: 100%;
        height: 100%;
    }

    #numbers {
        column-span: 4;
        padding: 0 1;
        height: 100%;
        background: $primary-lighten-2;
        color: $text;
        content-align: center middle;
        text-align: right;
    }

    #number-0 {
        column-span: 2;
    }
    """

    numbers = var("0")
    show_ac = var(True)
    left = var(Decimal("0"))
    right = var(Decimal("0"))
    value = var("")
    operator = var("plus")

    NAME_MAP = {
        "asterisk": "multiply",
        "slash": "divide",
        "underscore": "plus-minus",
        "full_stop": "point",
        "plus_minus_sign": "plus-minus",
        "percent_sign": "percent",
        "equals_sign": "equals",
        "minus": "minus",
        "plus": "plus",
    }

    def watch_numbers(self, value: str) -> None:
        """Called when numbers is updated."""
        self.query_one("#numbers", Digits).update(value)

    def compute_show_ac(self) -> bool:
        """Compute switch to show AC or C button"""
        return self.value in ("", "0") and self.numbers == "0"

    def watch_show_ac(self, show_ac: bool) -> None:
        """Called when show_ac changes."""
        self.query_one("#c").display = not show_ac
        self.query_one("#ac").display = show_ac

    def compose(self) -> ComposeResult:
        """Add our buttons."""
        with Container(id="calculator"):
            yield Digits(id="numbers")
            yield Button("AC", id="ac", variant="primary")
            yield Button("C", id="c", variant="primary")
            yield Button("+/-", id="plus-minus", variant="primary")
            yield Button("%", id="percent", variant="primary")
            yield Button("÷", id="divide", variant="warning")
            yield Button("7", id="number-7", classes="number")
            yield Button("8", id="number-8", classes="number")
            yield Button("9", id="number-9", classes="number")
            yield Button("×", id="multiply", variant="warning")
            yield Button("4", id="number-4", classes="number")
            yield Button("5", id="number-5", classes="number")
            yield Button("6", id="number-6", classes="number")
            yield Button("-", id="minus", variant="warning")
            yield Button("1", id="number-1", classes="number")
            yield Button("2", id="number-2", classes="number")
            yield Button("3", id="number-3", classes="number")
            yield Button("+", id="plus", variant="warning")
            yield Button("0", id="number-0", classes="number")
            yield Button(".", id="point")
            yield Button("=", id="equals", variant="warning")

    def on_key(self, event: events.Key) -> None:
        """Called when the user presses a key."""

        def press(button_id: str) -> None:
            """Press a button, should it exist."""
            try:
                self.query_one(f"#{button_id}", Button).press()
            except NoMatches:
                pass

        key = event.key
        if key.isdecimal():
            press(f"number-{key}")
        elif key == "c":
            press("c")
            press("ac")
        else:
            button_id = self.NAME_MAP.get(key)
            if button_id is not None:
                press(self.NAME_MAP.get(key, key))

    @on(Button.Pressed, ".number")
    def number_pressed(self, event: Button.Pressed) -> None:
        """Pressed a number."""
        assert event.button.id is not None
        number = event.button.id.partition("-")[-1]
        self.numbers = self.value = self.value.lstrip("0") + number

    @on(Button.Pressed, "#plus-minus")
    def plus_minus_pressed(self) -> None:
        """Pressed + / -"""
        self.numbers = self.value = str(Decimal(self.value or "0") * -1)

    @on(Button.Pressed, "#percent")
    def percent_pressed(self) -> None:
        """Pressed %"""
        self.numbers = self.value = str(Decimal(self.value or "0") / Decimal(100))

    @on(Button.Pressed, "#point")
    def pressed_point(self) -> None:
        """Pressed ."""
        if "." not in self.value:
            self.numbers = self.value = (self.value or "0") + "."

    @on(Button.Pressed, "#ac")
    def pressed_ac(self) -> None:
        """Pressed AC"""
        self.value = ""
        self.left = self.right = Decimal(0)
        self.operator = "plus"
        self.numbers = "0"

    @on(Button.Pressed, "#c")
    def pressed_c(self) -> None:
        """Pressed C"""
        self.value = ""
        self.numbers = "0"

    def _do_math(self) -> None:
        """Does the math: LEFT OPERATOR RIGHT"""
        try:
            if self.operator == "plus":
                self.left += self.right
            elif self.operator == "minus":
                self.left -= self.right
            elif self.operator == "divide":
                self.left /= self.right
            elif self.operator == "multiply":
                self.left *= self.right
            self.numbers = str(self.left)
            self.value = ""
        except Exception:
            self.numbers = "Error"

    @on(Button.Pressed, "#plus,#minus,#divide,#multiply")
    def pressed_op(self, event: Button.Pressed) -> None:
        """Pressed one of the arithmetic operations."""
        self.right = Decimal(self.value or "0")
        self._do_math()
        assert event.button.id is not None
        self.operator = event.button.id

    @on(Button.Pressed, "#equals")
    def pressed_equals(self) -> None:
        """Pressed ="""
        if self.value:
            self.right = Decimal(self.value)
        self._do_math()

app = CalculatorApp(driver_class=Driver)
widget = Widget(app, cols=50, rows=30)

# THE PANEL APP
import panel as pn

pn.extension("ipywidgets")

component = pn.Column(
    pn.pane.IPyWidget(widget, sizing_mode="stretch_both"),
    sizing_mode="stretch_both",
)

pn.template.FastListTemplate(
    logo="https://panel.holoviz.org/_static/logo_horizontal_dark_theme.png",
    title="Works with ipytextual",
    main=component,
).servable()
5 Likes

I’ve tried drawdata which also seems to work fine.

"""
[`drawdata`](https://github.com/koaning/drawdata) is a Python package providing a widget that allow you to draw a dataset in a Notebook or Panel data app.

In this app we fit a [`DecisionTreeClassifier`](https://scikit-learn.org/stable/modules/generated/sklearn.tree.DecisionTreeClassifier.html) to the drawn points and plots its decision boundary using the `DecisionBoundaryDisplay`.
"""
import numpy as np
import pandas as pd
import panel as pn
from drawdata import ScatterWidget
from matplotlib.figure import Figure
from sklearn.inspection import DecisionBoundaryDisplay
from sklearn.tree import DecisionTreeClassifier

pn.extension("tabulator")

# Reactive Expression used to hold the drawn data
data = pn.rx(pd.DataFrame())

# The drawdata widget
widget = ScatterWidget()

def on_change(change):
    data.rx.value = widget.data_as_pandas


widget.observe(on_change, names=["data"])

# Plot: Function plotting the decision boundary

def decision_boundary_plot(df):
    fig = Figure(figsize=(12, 6))
    ax = fig.subplots()

    if len(df) and (df["color"].nunique() > 1):
        X = df[["x", "y"]].values
        y = df["color"]

        classifier = DecisionTreeClassifier().fit(X, y)
        disp = DecisionBoundaryDisplay.from_estimator(
            classifier,
            X,
            response_method="predict_proba"
            if len(np.unique(df["color"])) == 2
            else "predict",
            xlabel="x",
            ylabel="y",
            alpha=0.5,
            ax=ax,
        )
        disp.ax_.scatter(X[:, 0], X[:, 1], c=y, edgecolor="k")
        ax.set_title("DecisionTreeClassifier")
    else:
        ax.text(
            0.5,
            0.8,
            "Use minimum two colors",
            color="#0072B5",
            fontsize=50,
            ha="center",
        )
        ax.axis("off")

    return fig

# Views: Finetune how to view the plot and table

plot_view = pn.pane.Matplotlib(
    data.pipe(decision_boundary_plot),
    height=500,
    format="svg",
    fixed_aspect=False,
    sizing_mode="stretch_width",
    name="Plot",
)
table_view = pn.widgets.Tabulator(data, pagination="local", page_size=15, name="Table")

# Layout: Organize in row

layout = pn.Row(
    pn.panel(widget, width=800),
    pn.Tabs(plot_view, table_view, dynamic=True, sizing_mode="stretch_width"),
)

# Template: Nicely styled template with sidebar and main area

pn.template.FastListTemplate(
    site="Panel",
    title="Draw the Decision Boundary with DrawData",
    sidebar=[
        pn.pane.Image("https://github.com/koaning/drawdata/raw/main/imgs/logo.png"),
        __doc__,
    ],
    main=[layout],
).servable()

# Serve with 'panel serve app.py --autoreload'
1 Like