My code goes like this but for some reason all subplots are connected.
I build two for loops, the first to iterate through column A (measurand) to make a separate plot for each measurand. So far so good.
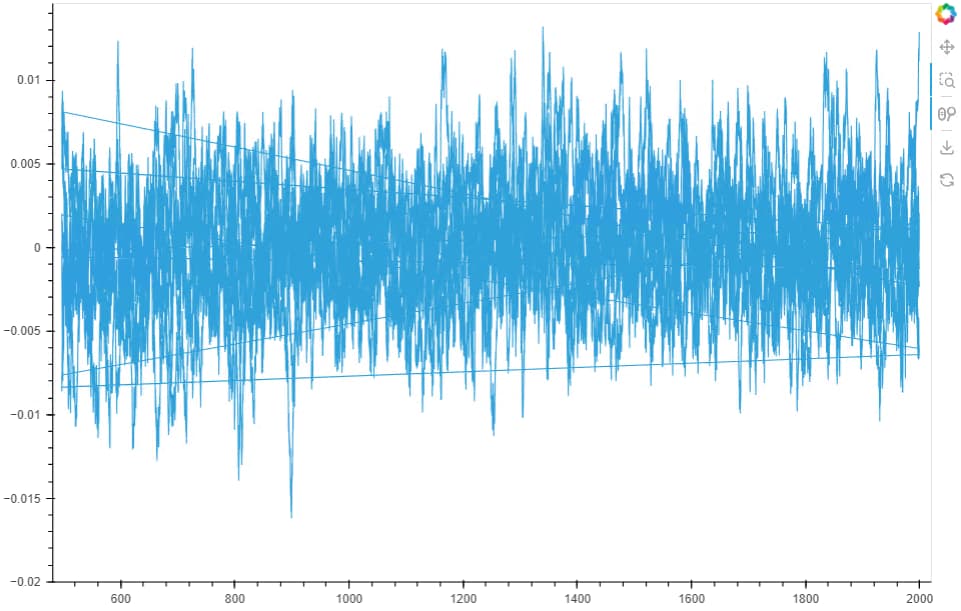
The next iteration is going through another Column ID, and for each unique ID a subplot should be drawn, with separate colors. It is not possible for me to get any colors. The graph will stay blank if I set color=ID_value. Also, all lines from the ID subplots are connected from the end to the beginning of the next. How can I fix this?
for measurand_value, group_df in filtered_df.groupby('measurand'):
    group_df = group_df.sort_values(by=['measurand', 'ID', 'freq'], ascending=True)
    dataset = hv.Dataset(group_df, kdims=['freq', 'signal'], vdims=['ID'])
    # Define y_range based on the condition
    if measurand_value in ('11x', '11y', '11z'):
        y_range = (-0.01, 0.01)
    else:
        y_range = (-0.1, 0.1)

    # Create a color cycle to distinguish 'ID' values
    #color_cycle = bokeh.palettes.Colorblind[8]

    for i, (ID_value, dut_group_df) in enumerate(group_df.groupby('ID')):
        path_plot = hv.Path(dataset, label=f"'measurand': {measurand_value}").opts(
            width=900, height=600, shared_axes=False, ylim=y_range
        )
        plot_column.append(path_plot)