While testing Datashader for GeoDataFrames, I noticed big performance differences between plotting a GeoDataFrame and creating a scatter plot for the same data as DataFrame. The following screenshot only shows half the story because the stated “Wall time” is much shorter than the actual wait time until the GeoDataFrame plot appears:
So as of the current HoloViews release (1.12.7) the datashader integration does not have support for polygons and for lines/points it’ll be fairly slow right because it converts the geometries each time you datashade (perhaps very inefficiently). In the coming release (1.13.0) both issues will be addressed in that it will convert the geopandas dataframe to a spatialpandas dataframe using a much more optimized codepath and datashader now has support to read spatialpandas geometries directly. At that point I might recommend that you convert your geopandas dataframes to spatialpandas before plotting which means that it won’t have to reconvert it every time you zoom or pan.
If you’re only working with points, I don’t think there is anything you need to wait for – simply convert your GeoDataFrame to a regular DataFrame with a column for x and a column for y; that’s the correct thing to do for plotting and any other performance-sensitive operation in any case, because then you end up with a compact and efficient representation for your coordinates – a Numpy array for x and a Numpy array for y, with each x or y value represented as a single number. With current GeoPandas versions, points (coordinate pairs) are represented as big Python-based Shapely objects which have to be processed in interpreted Python then unpacked very laboriously to pull out the underlying two scalar numbers that represent the coordinates, which is a massively inefficient operation compared to simply accessing two floating point numbers in a compact Numpy array directly from machine code as Datashader does it. GeoPandas version 0.8 that I hope will appear soon should greatly improve the situation by storing a compact array of C++ GEOS objects instead of Python Shapely objects, which should give much less of a performance hit by eliminating Python from the unpacking steps and allowing efficient traversal of the whole array of coordinates, but we may need to provide specific support in Datashader for making use of that when it is released. In any case, you’ll always get vastly higher performance if you can skip Python altogether if all you’re doing is traversing an array of simple scalar objects, so if you can do that (as has always been possible for Datashading a collection of points), that’s always going to give the best performance.
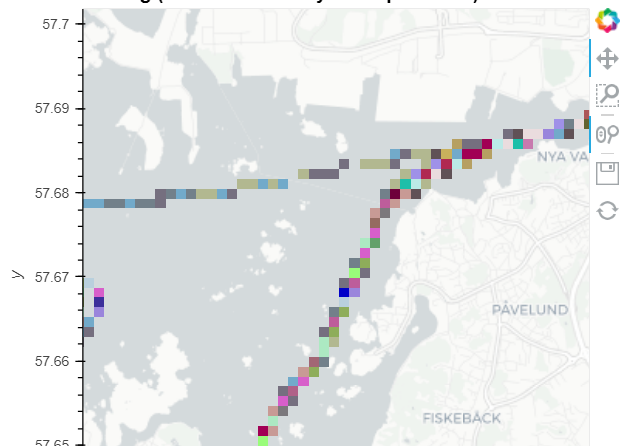
With geopandas 0.12.2 and holoviews 1.15.3, I’m now observing that gdf.hvplot(datashade=True) now does not use the original blue gradient cmap but random colors by default: