Hi all,
I would like to plot a raster plot of spikes. So basically I will have several spike plots overlayed (on top of each other). This works fine, but in case I have several rows of spike plots, the performance gets really poor. Is there any way to speed up the plotting? Especially when I would like to zoom in or out or move the plot, it takes a long time to visualise everything. I tried to implement it with Bokeh Apps and to run in on a more powerful machine, but nothing seemed to help.
E.g. I used a dataframe as the data format and created Spikes from the data and then used either overlay to combine the different spikes plots or just added them with * like in the example below.
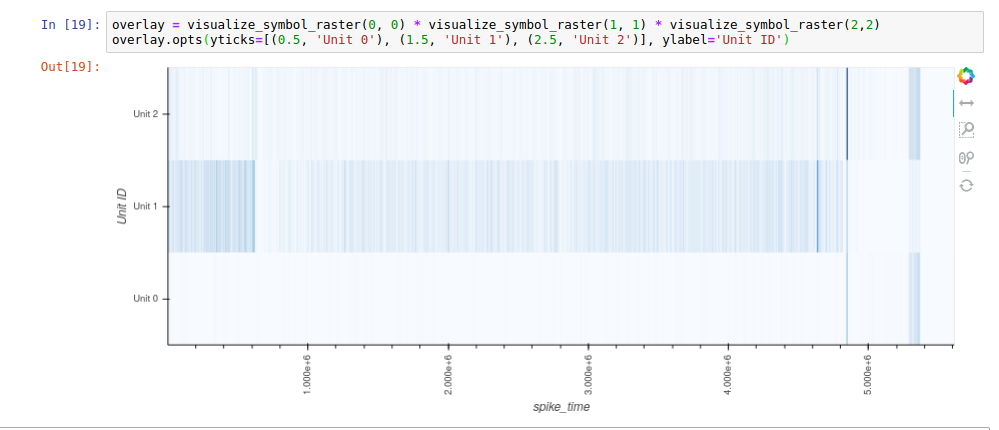
Here’s a screenshot of a minimal version of the plot with only three plots overlayed:
I’d be very happy for any suggestions!
Many thanks,
Tamara