Hi ,
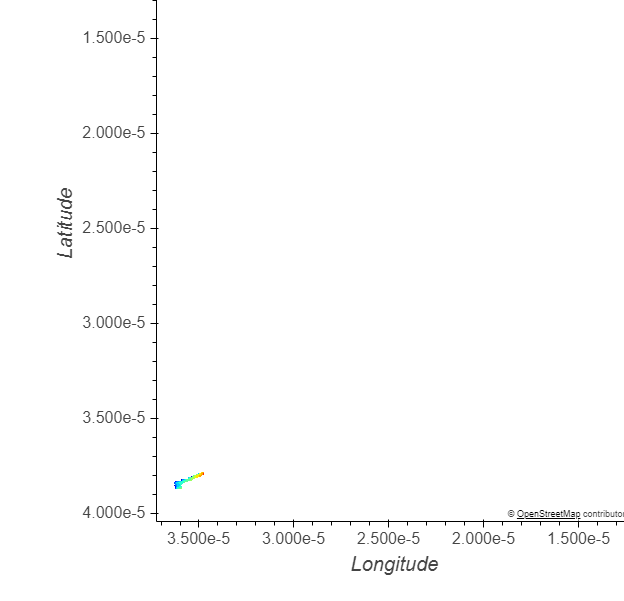
I have plot when i am seeing the plot the latitude and longitude values in xlabel and ylable are shown in e5 power**, I want my latitude longitude to be shown in 5 decimal place.**
I have latest holoviews and geoviews modules.
flask 1.1.2 py_0
freetype 2.10.2 hd328e21_0
freexl 1.0.5 hfa6e2cd_0
fsspec 0.7.4 py_0
future 0.18.2 py37_1
gdal 2.3.3 py37hdf43c64_0
geopandas 0.6.1 py_0
geos 3.7.1 h33f27b4_0
geoviews 1.8.1 py_0
geoviews-core 1.8.1 py_0
get_terminal_size 1.0.0 h38e98db_0
gevent 20.6.2 py37he774522_0
glob2 0.7 py_0
gmpy2 2.0.8 py37h0964b28_3
greenlet 0.4.16 py37he774522_0
h5py 2.10.0 py37h5e291fa_0
hdf4 4.2.13 h712560f_2
hdf5 1.10.4 h7ebc959_0
heapdict 1.0.1 py_0
holoviews 1.13.3 py_0 pyviz
html5lib 1.1 py_0
icc_rt 2019.0.0 h0cc432a_1
icu 58.2 vc14hc45fdbb_0 [vc14] anaconda
idna 2.10 py_0
imageio 2.9.0
I dont want whole globe.
I want small part of near y
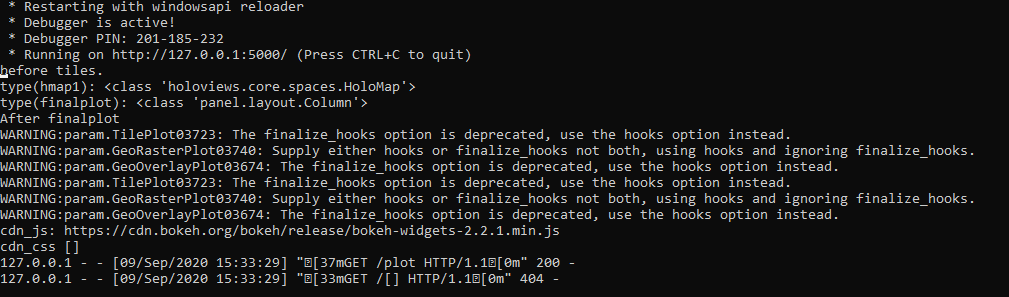
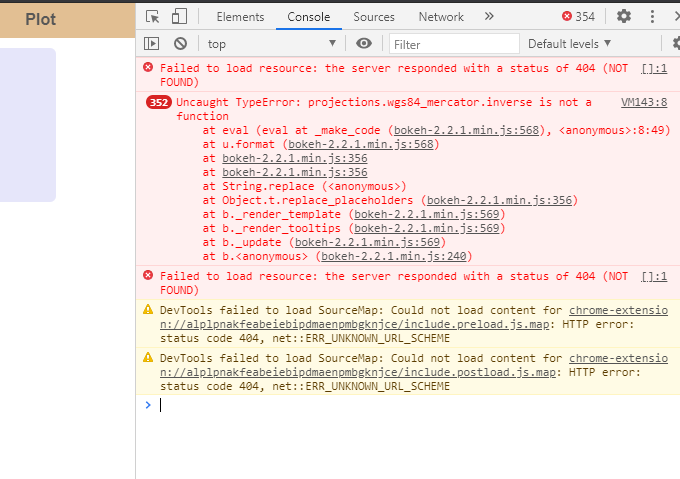
Output is below.