Plotly figure not updating correctly from Panel widgets connected using Panel .bind

I have some functions set up like this to try to create interactive Plotly figures that can be changed based on buttons or Select menus:

select_combat_stat = pn.widgets.Select(name='Combat Stat Selection',
                                       options=['dmg_taken', 'dmg_dealt', 'dmg_mitigated','dmg_healed'],
                                       value='dmg_taken')

def total_combat_stat(cntxt):
    gb = pc_combat_stats_df.groupby('pc').sum().reset_index()

    fig = px.bar(gb,
                 x='pc',
                 y=cntxt,
                 color='pc',
                 color_discrete_map = pc_color_map,
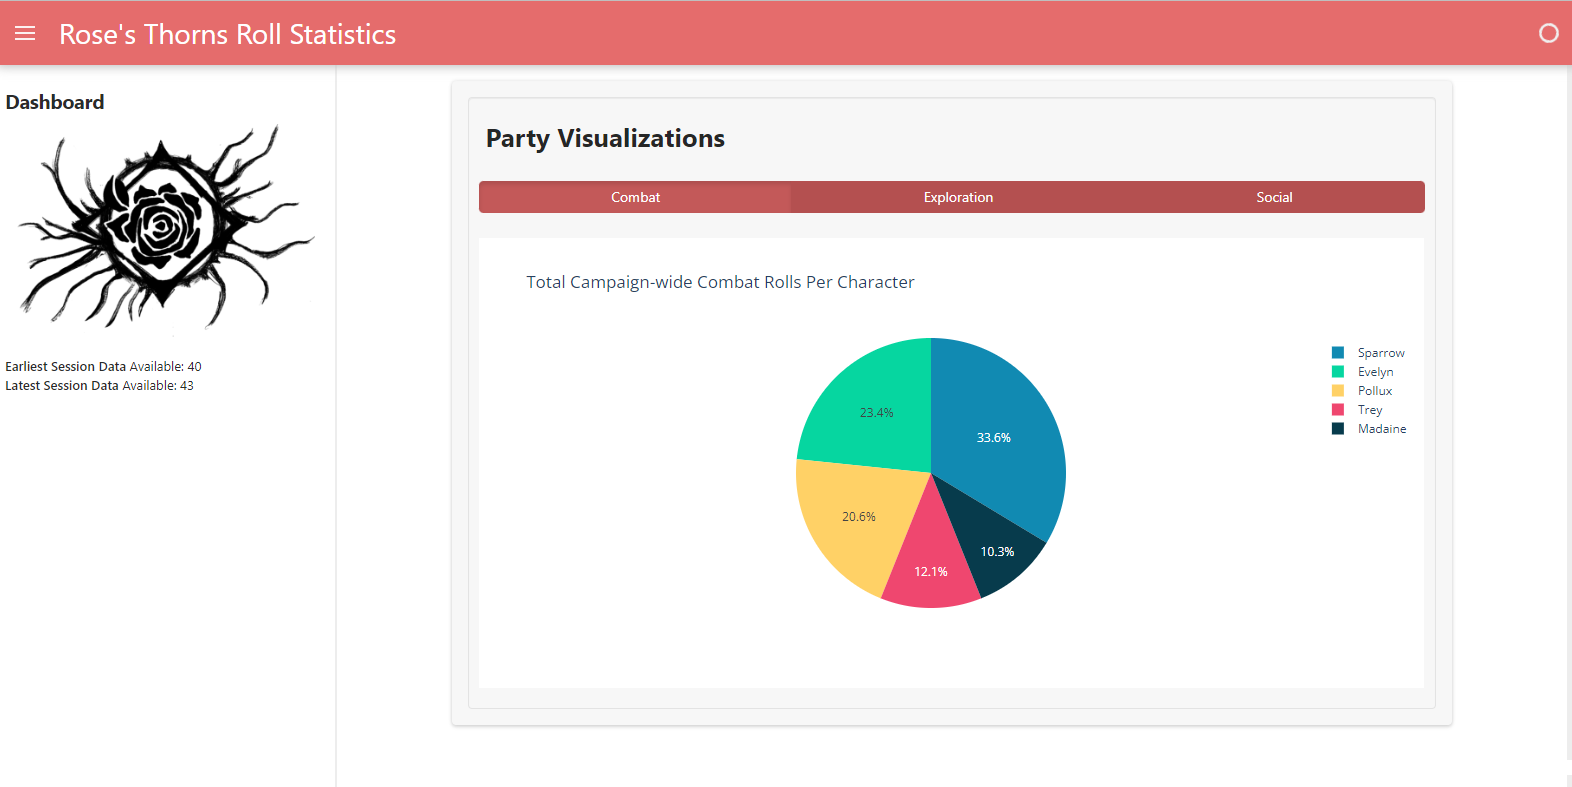
                 title=f'Total Campaign-wide {cntxt} Per Character')
    return fig

party_combat_box = pn.WidgetBox(pn.Column(pn.Row(pn.pane.Markdown(f"# Party Combat Visualizations")),
                                          pn.Row(pn.bind(total_combat_stat,select_combat_stat), pn.bind(total_combat_stat_per_session,select_combat_stat)),
                                          align="start", sizing_mode="stretch_width"))

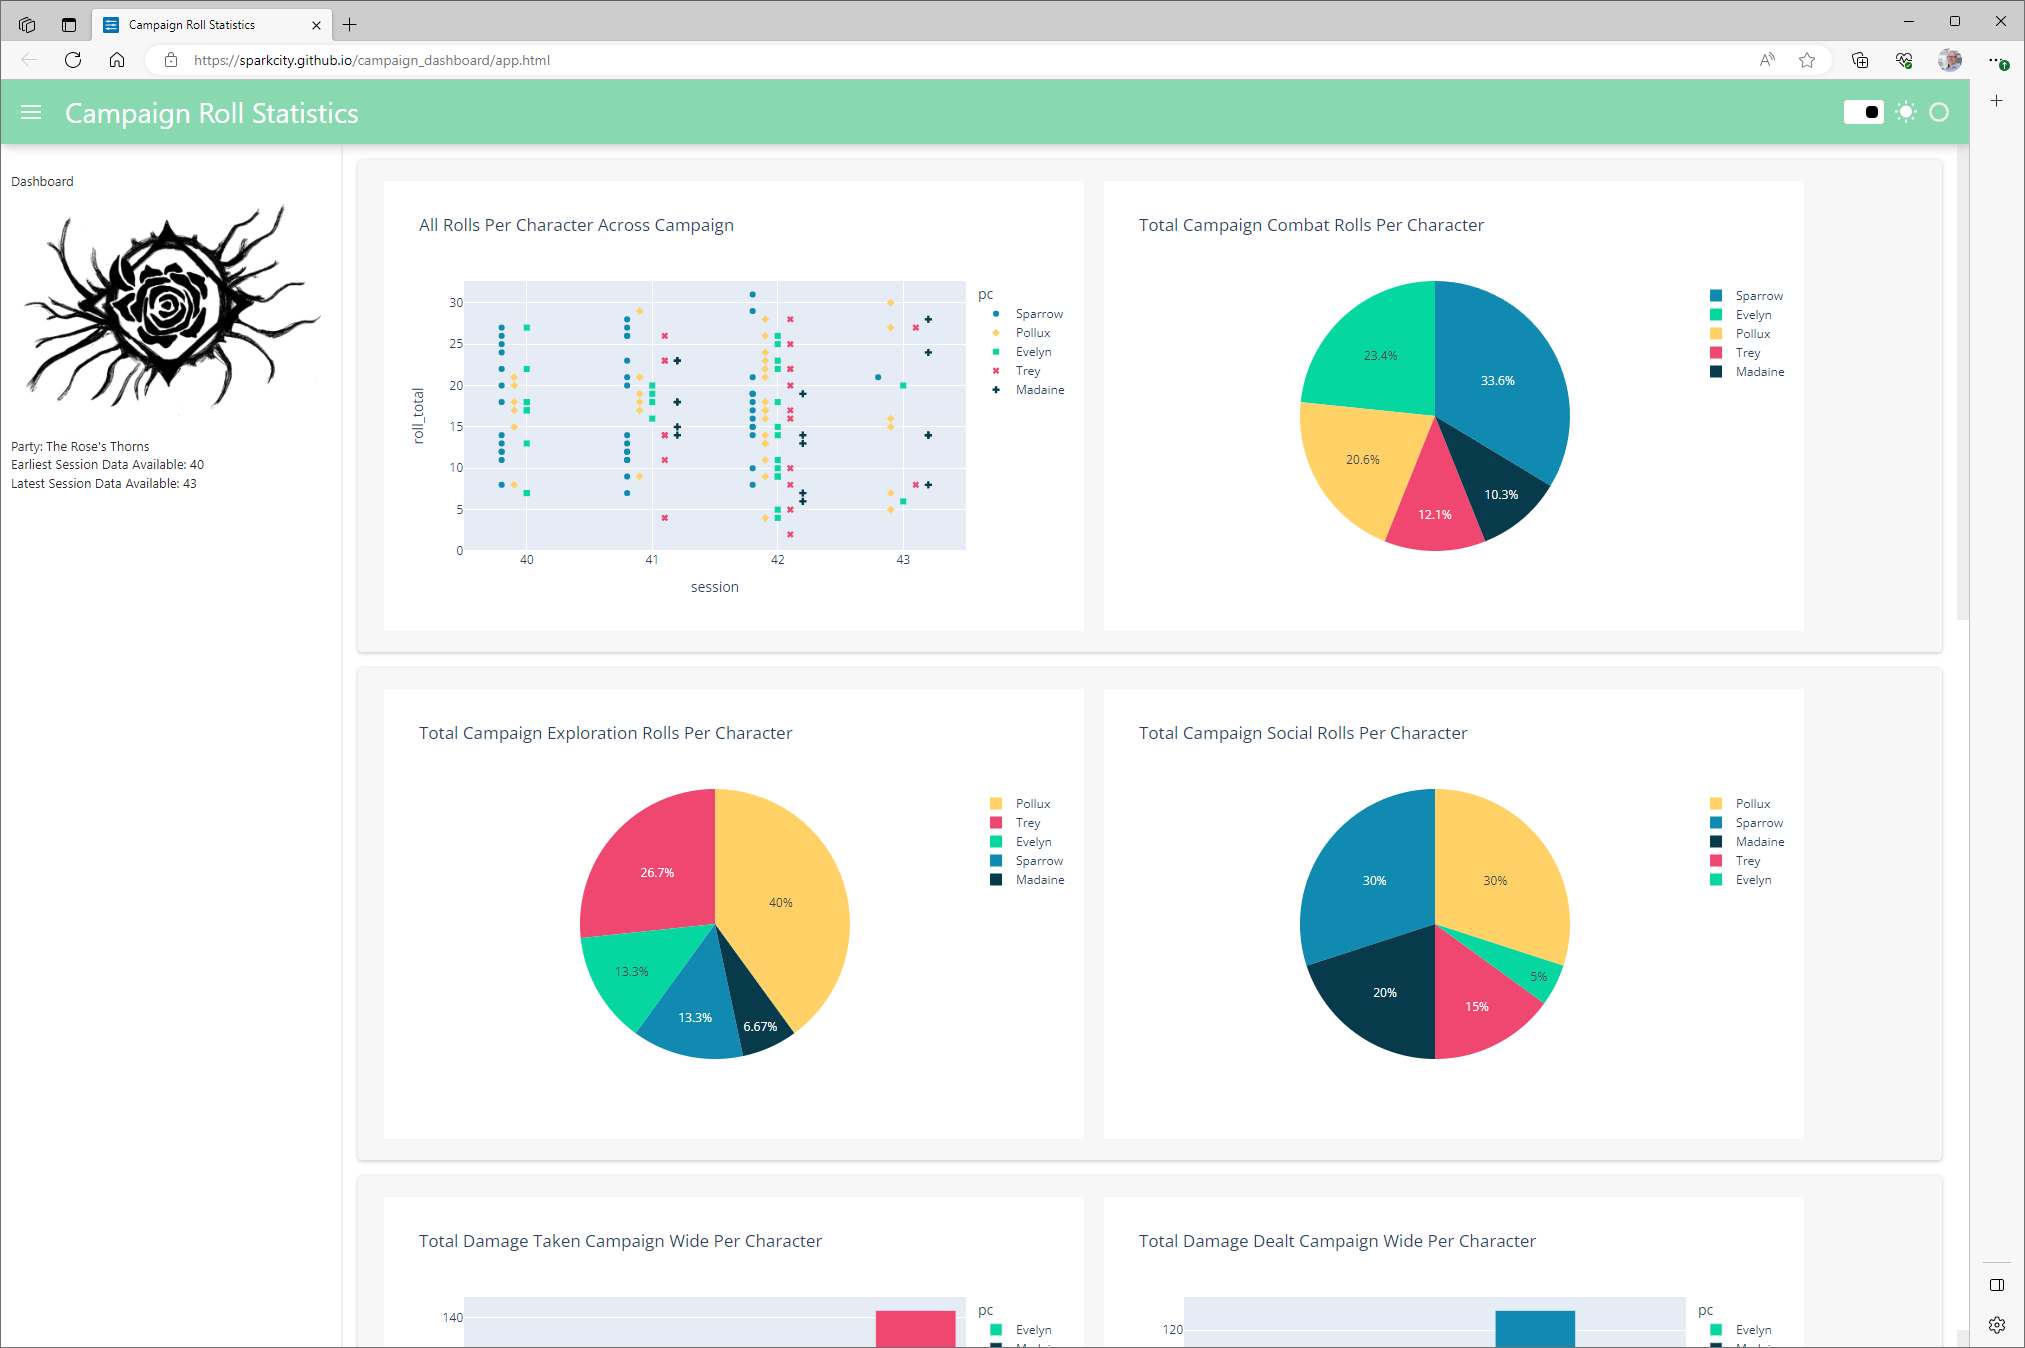
And then I have the dashboard itself set up like:

template = pn.template.FastListTemplate(
......
    main=[pn.Row(party_box),
          pn.Row(party_combat_box)],
....
)
template.show()
template.servable();

It shows up correctly upon first launching the server locally. I select a new option from the dropdown and the figure doesn’t change. But if I select a different option from the dropdown a second time, it shows the correct figure for the last option I chose.

Example: It starts out with dmg_taken as the default value. I select dmg_healed, and it continues showing dmg_taken figure. I select dmg_mitigated, and it will show the figure for dmg_healed, my last option chosen. I select dmg_taken again, it will show the dmg_mitigated figure. Etc, etc.

Any ideas for a fix?

Hi @strep

Welcome to the community.

Could you provide a minimum, reproducible example including data?

A minimum, reproducible example will help me focus on helping you. With the current example it will take some time to create a dataset and get the code working. Furthermore I might take some wrong choices not replicating your choices and issues.

Thanks.

################################# Imports and Initializations

import pandas as pd
import numpy as np
import panel as pn
import plotly.express as px
import plotly.io as pio
import plotly.graph_objects as go

pn.extension('tabulator')
pn.extension()
pio.renderers.default='iframe'

pc_rolls_df = pd.DataFrame(pd.read_csv('https://raw.githubusercontent.com/sparkcity/campaign_dashboard/main/src/data/starbound_pc_rolls.csv'))

pc_color_map = {'Sparrow':'#118ab2',
                'Madaine':'#073b4c',
                'Evelyn':'#06d6a0',
                'Pollux':'#ffd166',
                'Trey':'#ef476f'}

sess_min = (pc_rolls_df['session'].min()).item()
sess_max = (pc_rolls_df['session'].max()).item()

################################# Party Visualizations: Context and Overall Rolls

select_context = pn.widgets.RadioButtonGroup(name='Context Selection',
                                             options=['Combat', 'Exploration', 'Social'],
                                             value='Combat',
                                             button_type='success')

def total_contextual_fig(cntxt):
    pv1_df = pc_rolls_df.groupby(['pc','context']).size().unstack(fill_value=0).reset_index()
    
    pv1_fig = px.pie(pv1_df,
                     values=cntxt,
                     names= 'pc', 
                     color='pc',
                     color_discrete_map = pc_color_map,
                     title = f'Total Campaign-wide {cntxt} Rolls Per Character')
    return pv1_fig

party_box = pn.WidgetBox(pn.Column(pn.Row(pn.pane.Markdown(f"# Party Visualizations")),
                                   pn.Row(select_context),
                                   pn.Row(pn.bind(total_contextual_fig,select_context)),
                                   align="start", sizing_mode="stretch_width"))

################################# Layout Template

template = pn.template.FastListTemplate(
    title='Rose\'s Thorns Roll Statistics', 
    sidebar=[pn.pane.Markdown("Dashboard"), 
             pn.pane.PNG('https://raw.githubusercontent.com/sparkcity/campaign_dashboard/main/img/thorns_logo.png', sizing_mode='scale_both'),
             pn.pane.Markdown(f"""Earliest Session Data Available: {sess_min}
             <br/>Latest Session Data Available: {sess_max}""")
             ],
    main=[pn.Row(party_box)],
    accent_base_color="#e56c6c",
    header_background="#e56c6c",
)
template.show()
template.servable();

And here’s a sample from the dataset (csv) and here’s the link to the csv on Github https://raw.githubusercontent.com/sparkcity/campaign_dashboard/main/src/data/starbound_pc_rolls.csv:

pc,session,type,context,skill_check,ability_save,roll_base,roll_total
Sparrow,42,Check,Combat,Athletics,null,18,31
Evelyn,42,Check,Combat,Athletics,null,10,14
Sparrow,42,Attack,Combat,null,null,6,15
Evelyn,42,Attack,Combat,null,null,9,23
Evelyn,42,Attack,Combat,null,null,16,22
Pollux,42,Attack,Combat,null,null,14,22
Trey,42,Check,Exploration,Perception,null,1,2
Trey,42,Check,Exploration,Perception,null,3,5
Sparrow,42,Check,Social,Insight,null,11,19
Evelyn,42,Check,Social,Insight,null,17,26
Pollux,42,Check,Social,Insight,null,20,21
Trey,42,Check,Social,Insight,null,15,16
Madaine,43,Check,Social,History,null,15,24
Madaine,43,Check,Social,Deception,null,15,28
Pollux,43,Check,Social,Arcana,null,2,15

Hi @strep

Running it with python script.py

I’ve tried running you example with python script.py command and it works like below. Does it not work as it should?

I’m on panel==1.1.1 and bokeh=3.1.1

Fixing Issues

I see a few issues

  • You are mixing .show() and .servable(). You should pick one or the other. And probably .servable().
  • You have two pn.extension. You only need the first one.
  • You are missing "plotly" in pn.extension.
  • You have pio.renderers.default = "iframe". It seems to work, but I would not think its needed (?).
  • You don’t use sizing_mode='stretch_width'. I would recommend that.
  • You are putting single components inside pn.Row inside pn.Column. This is not needed.

My version would be something like the below

################################# Imports and Initializations

import pandas as pd
import panel as pn
import plotly.express as px

ACCENT = "#e56c6c"

SUCCESS_SOLID_BUTTON_STYLE = f"""
.bk-btn-success {{
    background-color: var(--accent-foreground-rest, {ACCENT});
}}
.bk-active.bk-btn-success {{
    background-color: var(--accent-foreground-active, {ACCENT});
}}
.bk-btn-success:hover {{
    background-color: var(--accent-foreground-hover, {ACCENT});
}}
"""

pn.extension("plotly", "tabulator", sizing_mode="stretch_width")

pc_rolls_df = pd.DataFrame(
    pd.read_csv(
        "https://raw.githubusercontent.com/sparkcity/campaign_dashboard/main/src/data/starbound_pc_rolls.csv"
    )
)

pc_color_map = {
    "Sparrow": "#118ab2",
    "Madaine": "#073b4c",
    "Evelyn": "#06d6a0",
    "Pollux": "#ffd166",
    "Trey": "#ef476f",
}

sess_min = (pc_rolls_df["session"].min()).item()
sess_max = (pc_rolls_df["session"].max()).item()

################################# Party Visualizations: Context and Overall Rolls

select_context = pn.widgets.RadioButtonGroup(
    name="Context Selection",
    options=["Combat", "Exploration", "Social"],
    value="Combat",
    button_type="success",
    stylesheets=[SUCCESS_SOLID_BUTTON_STYLE],
)


def total_contextual_fig(cntxt):
    pv1_df = pc_rolls_df.groupby(["pc", "context"]).size().unstack(fill_value=0).reset_index()

    pv1_fig = px.pie(
        pv1_df,
        values=cntxt,
        names="pc",
        color="pc",
        color_discrete_map=pc_color_map,
        title=f"Total Campaign-wide {cntxt} Rolls Per Character",
    )
    pv1_fig.update_layout(autosize=True)
    return pv1_fig


party_box = pn.WidgetBox(
    pn.pane.Markdown(f"# Party Visualizations"),
    select_context,
    pn.panel(pn.bind(total_contextual_fig, select_context), margin=(10, 2, 10, 5)),
)

################################# Layout Template

template = pn.template.FastListTemplate(
    title="Rose's Thorns Roll Statistics",
    sidebar=[
        pn.pane.Markdown("## Dashboard"),
        pn.pane.PNG(
            "https://raw.githubusercontent.com/sparkcity/campaign_dashboard/main/img/thorns_logo.png",
            sizing_mode="scale_both",
        ),
        pn.pane.Markdown(
            f"""**Earliest Session Data** Available: {sess_min}
             <br/>**Latest Session Data** Available: {sess_max}"""
        ),
    ],
    main=[party_box],
    main_max_width="1000px",
    accent=ACCENT,
    theme_toggle=False,
)
template.servable()

If you like this example please consider sharing or liking this tweet. It helps promote Panel. Thanks.

1 Like

sparkcity/campaign_dashboard looks awesome

You app sparkcity/campaign_dashboard looks awesome by the way

image

Please note many people advice against Pie charts and say they are hard to read. They recommend using bar charts instead.

Hi Marc, thank you so much for your troubleshooting and advice! It’s my first foray into developing with Panel so it’s been a lot of learning this month. This has been extremely helpful and educational. I will implement the recommended edits and see how it behaves.

I’ve been testing and launching through Jupyter Lab, could that be the reason for the slightly strange behavior that I’ve seen?

1 Like

Maybe. If you have further issues, then try to strip down or create a minimum, reproducible example in notebook. Then share it here :+1:

1 Like

Strangely, it does seem like the only thing causing the issue was being launched from Jupyter-Lab. The app itself it hosted on github pages with no problems or unexpected behavior.

Thank you for all of the help!

1 Like