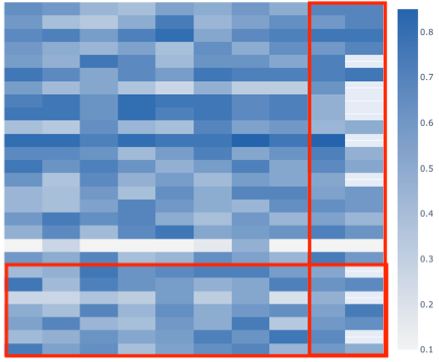
I’m having difficulty with clickdata callbacks on a heatmap through a plotly widget and Panel. I can get the heatmap to render in a plotly pane, and can click many of the cells and get a clickdata event, but there seems to be a region on the bottom and on the right of the heatmap grid that is not clickable. I’ve tried resizing the heatmap to as much as 1200x1200, and that seems to limit the region that is unclickable, but I still an unable to click the last couple of rows and the last column. On a smaller size of around 500-600px, there are 7 bottom rows and 2 columns that are not clickable (I get no event when clicked). Same behavior when the pane is the only thing on the screen.
Here’s how we initialize the heatmap:
heatmap = get_score_plot()
heatmap.param.watch(draw_dashboard, ‘click_data’)
def (get_score_plot)
….
fig2 = go.Figure(data=go.Heatmap(z=z_values, x=x_values, y=y_values, colorscale=color_scale),
layout={“margin”:{“l”:2, “r”:2, “t”:30, “b”:30}, “xaxis”:{“showticklabels”:not do_not_show_x_labels}})
fig2 = fig2.to_dict()
heatmap = pn.pane.Plotly(fig2, sizing_mode=“stretch_both”, name=“heatmap”)
tab=pn.Column(system_message, pn.layout.Divider(),
pn.Row(pn.Column(regulatory_heatmap, height=600),
pn.Card(pn.Row(pn.Column(regulatory_framework_selector, width=200, margin=(0,20,0,0)),pn.Column(pn.pane.HTML(“A Message”), progress_bar), margin=(20,0,20,0)), ….
tabs=pn.Tabs(tab)
layout=pn.Column(tabs, floating_row)
layout.servable()
Could there be something overlapping with the heatmap that is interfering with the detection of mouseclick? Any suggestions for how to debug?
Thank you