As I’m trying to understand how to use pn.pane.Plotly I have experienced a couple of issues. They are probably related to my inexperience, so I’m asking for help.
First example:
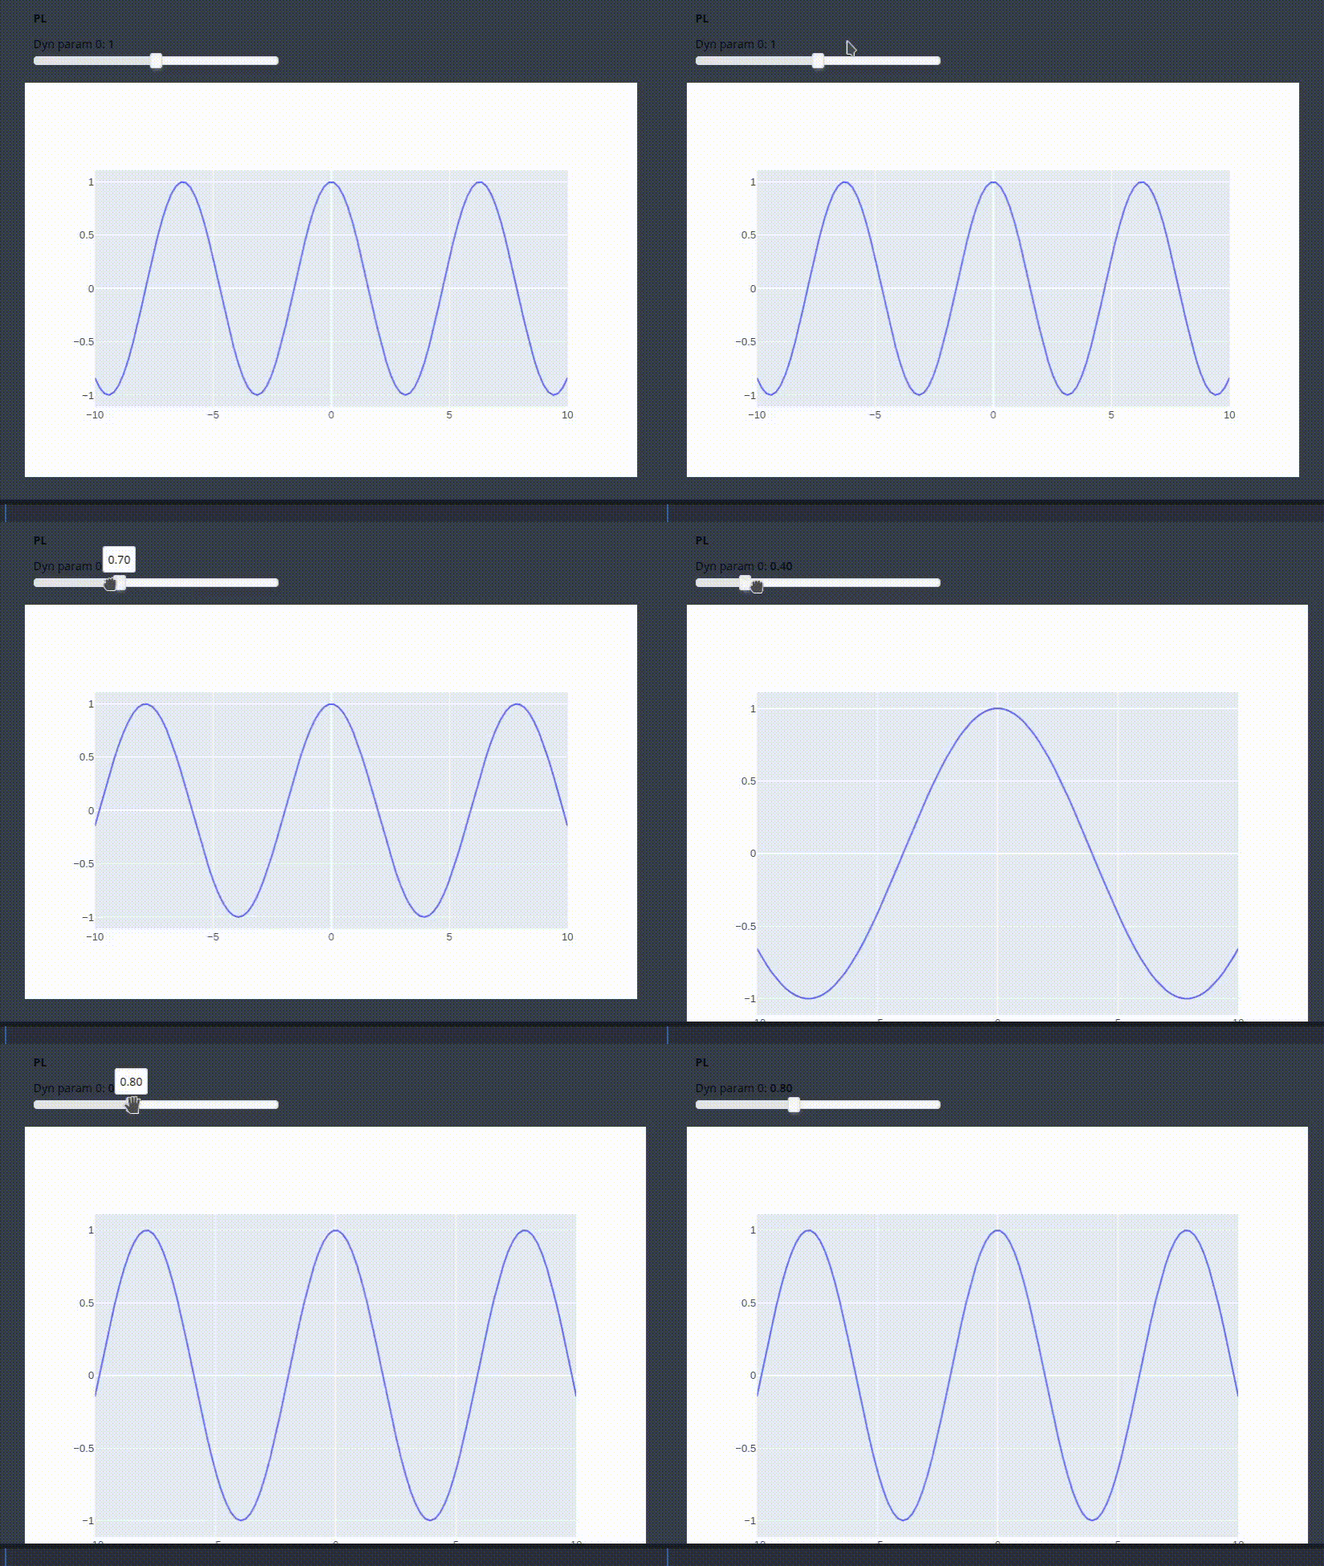
After running the application, it might happen that Plotly pane increases its height. This is annoying because:
- if the app is run inside Jupyter Notebook, the resizing prevents the the x-axis to be visible. Users have to scroll down.
- if the app is served to a new browser window, the pane is going to use all the available height.
import param
import panel as pn
pn.extension("plotly")
import numpy as np
import plotly.graph_objects as go

class PL(param.Parameterized):
    check_val = param.Integer(default=0)

    def __init__(self, func, *parameters):
        super().__init__()

        # remove the previous class attributes added by the previous instances
        cls_name = type(self).__name__
        setattr(type(self), "_" + cls_name + "__params", dict())
        prev_params = [k for k in type(self).__dict__.keys() if "dyn_param_" in k]
        for p in prev_params:
            delattr(type(self), p)

        self.mapping = {}
        # create and attach the params to the class
        for i, p in enumerate(parameters):
            pname = "dyn_param_{}".format(i)
            # TODO: using a private method: not the smartest thing to do
            self.param._add_parameter(pname, p)
            self.param.watch(self._increment_val, pname)
            self.mapping[i] = pname

        self.func = func
        self.x = np.linspace(-10, 10, 100)
        y = func(self.x, 1)
        self.fig = go.Figure([
            go.Scatter(x=self.x, y=y)
        ])
        self.pane = pn.pane.Plotly(self.fig)

    def _increment_val(self, *depends):
        self.check_val += 1

    def _read_parameters(self):
        readout = []
        for k, v in self.mapping.items():
            readout.append(getattr(self, v))
        return readout

    @param.depends("check_val", watch=True)
    def _update(self):
        y = self.func(self.x, *self._read_parameters())
        self.fig.data[0]["x"] = self.x
        self.fig.data[0]["y"] = y
        self.pane.object = self.fig

    def show(self):
        return pn.Column(pn.Param(self, parameters=list(self.mapping.values())), self.pane)

f = lambda x, t: np.cos(x * t)
c = PL(f, param.Number(default=1, softbounds=(0, 2)))
c.show()

It is interesting to note that if I return just the Plotly figure, everything works fine with no resizing.
    def show(self):
        return pn.Column(pn.Param(self, parameters=list(self.mapping.values())), self.fig)
Second example
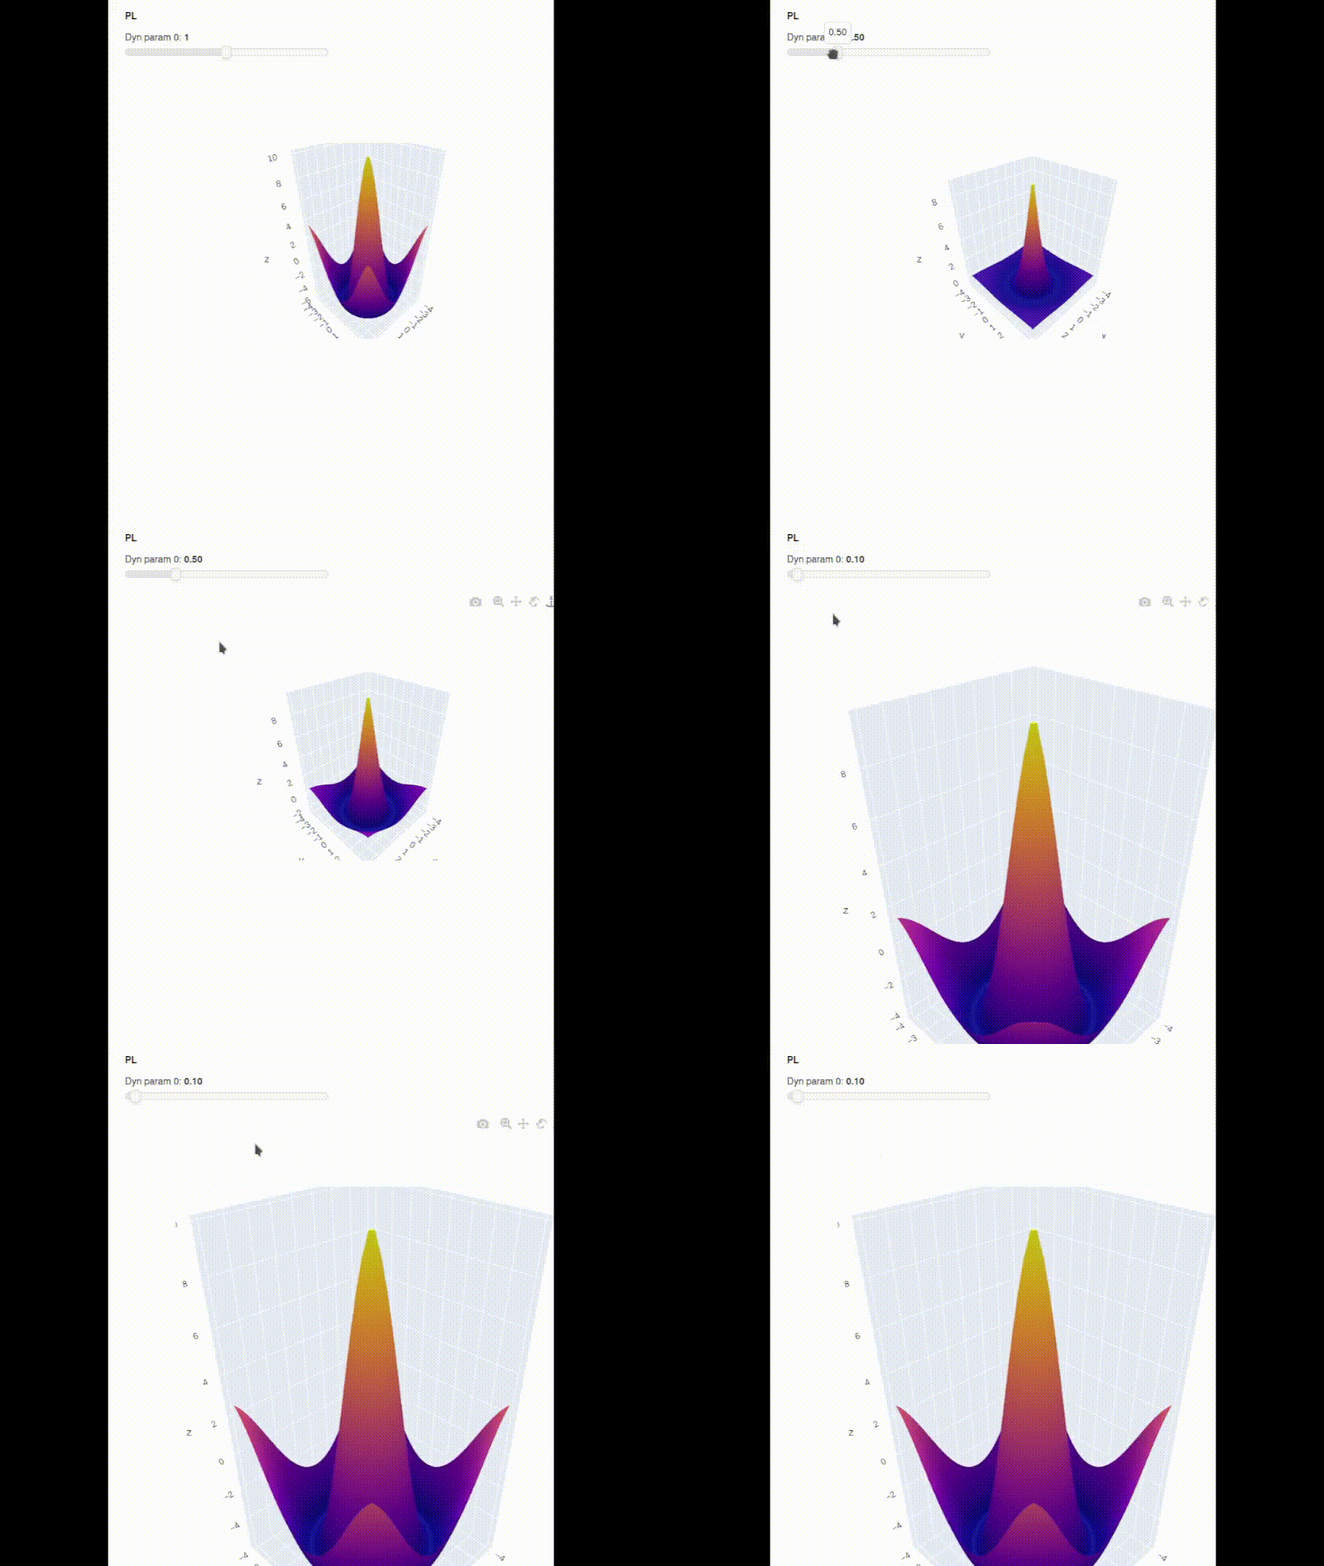
On top of the resizing problem mentioned earlier, this example exhibits a new problem only when the application is served to a browser window. In particular, it seems like the application freezes and keeps repeating a few updates over and over again, even when the click has been released from the slider.
import param
import panel as pn
pn.extension("plotly")
import numpy as np
import plotly.graph_objects as go

class PL(param.Parameterized):
    check_val = param.Integer(default=0)

    def __init__(self, func, *parameters):
        super().__init__()

        # remove the previous class attributes added by the previous instances
        cls_name = type(self).__name__
        setattr(type(self), "_" + cls_name + "__params", dict())
        prev_params = [k for k in type(self).__dict__.keys() if "dyn_param_" in k]
        for p in prev_params:
            delattr(type(self), p)

        self.mapping = {}
        # create and attach the params to the class
        for i, p in enumerate(parameters):
            pname = "dyn_param_{}".format(i)
            # TODO: using a private method: not the smartest thing to do
            self.param._add_parameter(pname, p)
            self.param.watch(self._increment_val, pname)
            self.mapping[i] = pname

        self.func = func
        x = y = np.linspace(-4, 4, 50)
        self.x, self.y = np.meshgrid(x, y)
        z = func(self.x, self.y, 0.15)
        self.fig = go.Figure([
            go.Surface(x=self.x, y=self.y, z=z)
        ])
        self.pane = pn.pane.Plotly(self.fig)

    def _increment_val(self, *depends):
        self.check_val += 1

    def _read_parameters(self):
        readout = []
        for k, v in self.mapping.items():
            readout.append(getattr(self, v))
        return readout

    @param.depends("check_val", watch=True)
    def _update(self):
        z = self.func(self.x, self.y, *self._read_parameters())
        self.fig.data[0]["z"] = z
        self.pane.object = self.fig

    def show(self):
        return pn.Column(pn.Param(self, parameters=list(self.mapping.values())), self.pane)

f = lambda x, y, t: 10 * np.cos(np.sqrt(x**2 + y**2)) * np.exp(-np.sqrt(x**2 + y**2) * t)
c = PL(f, param.Number(default=1, softbounds=(0, 2)))
c.show().show()
