Has anyone noticed that when a plotly plot is allowed to autosize it doesnt fit within its container correctly? I noticed this since i am including it in a pn.Tabs element and drawing a border around the container. I am setting the height of the plot but then using sizing_mode="stretch_width" and in the plot layout autosize: True. (see example code below)
The issue it seems, is that panel (or bokeh?) sets the element style left: 5px with a width equal to the width of the container, forcing the plot to overhang 5px off the right.
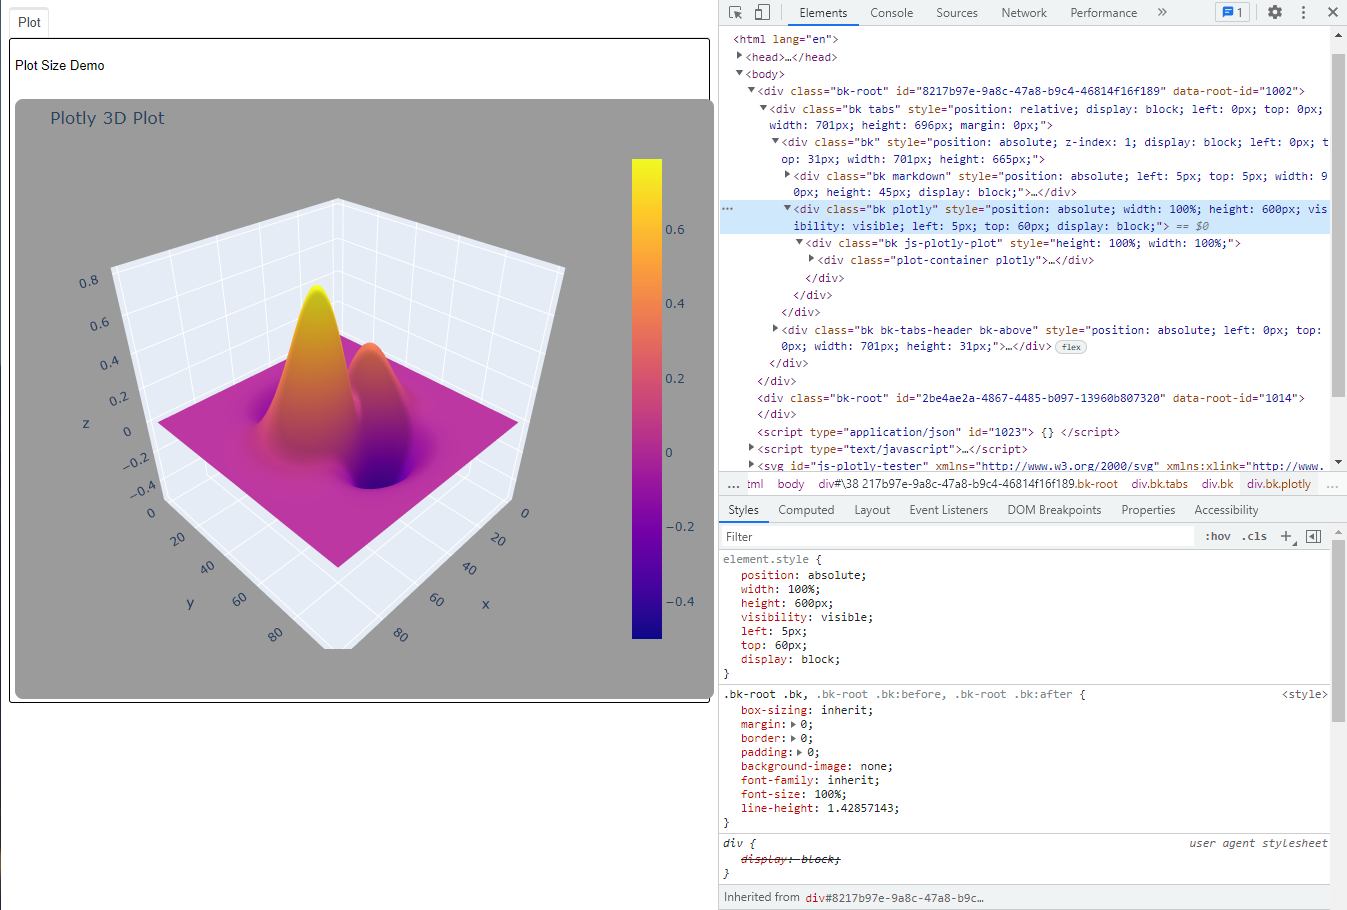
How might i over-ride that? I would like margin: 5px not left: 5px to center the plotly pane in its container.
I’ve tried using css, but that property seems to be set in the elements style tag which makes it override the css.
As a side note, it would be handy if Panel included an identifying class in the top level div for each element, in this example i manually set some classes. But including the element type would be convenient, ie Tabs, Plotly, Column, etc.
example code:
import numpy as np
import panel as pn
import plotly.graph_objs as go

CSS = """
.bk.tabs > div:not(.bk-tabs-header){
    border: 1px solid;
    border-radius: 3px;
}
.bk.plotly {
    left:0;
    margin:5px;
}
.svg-container {
    border-radius:8px;
    overflow:hidden;
    width:90%;
    margin:auto;
}
"""

pn.extension("plotly", raw_css=[CSS])


def main_app():
    """main"""

    # Generate some data for Plotly 3D chart:
    xx = np.linspace(-3.5, 3.5, 100)
    yy = np.linspace(-3.5, 3.5, 100)
    x, y = np.meshgrid(xx, yy)
    z = np.exp(-((x - 1) ** 2) - y**2) - (x**3 + y**4 - x / 5) * np.exp(
        -(x**2 + y**2)
    )

    # Plotly figure:
    surface = go.Surface(z=z)
    layout = go.Layout(
        title="Plotly 3D Plot",
        autosize=True,
        margin=dict(t=50, b=50, r=50, l=50),
        paper_bgcolor="#9b9b9b",
        uirevision=True,  # Lets Plotly to keep layout and view angle even after data updates in the figure
    )

    # Create Plotly pane:
    fig = dict(data=[surface], layout=layout)
    plotly_pane = pn.pane.Plotly(
        fig,
        height=600,
        sizing_mode="stretch_width",
        css_classes=["plotly"],
    )

    tab = pn.Tabs(
        pn.Column(
            "Plot Size Demo",
            plotly_pane,
            name="Plot",
            sizing_mode="stretch_width",
        ),
        css_classes=["tabs"],
    )

    return tab.servable()


if __name__ == "__main__":
    pn.serve(
        {"Plotly_Demo": main_app},
        port=8080,
        title="Fitting Demo",
        show=False,
        autoreload=False,
    )