I’m using FastGridTemplate to make a plotting dashboard that has 4 geographic plots. I have an on-click event that plots multiple timeseries in the sidebar given a click location. This method works great in terms of everything but sizing. The goal is to have the 5 timeseries match the width of the sidebar with a responsive height such that all the plots fit without triggering a scrollbar.
If I use the responsive=True option in each plot, no matter which method I use for the Layout (e.g. pn.Column, (plot1+plot2+…).cols(1), etc), the plots achieve the perfect height and width, but they overlap. A minimal, reproducible example is a little difficult to come up with, but here is the function which triggers the plots. “state.data” is an xarray dataset loaded into memory. Does anyone have any tips/tricks to get the behavior I am looking for?
template = pn.template.FastGridTemplate()

@pn.depends(clicker_wind.param.x,clicker_wind.param.y)
def side_plots(x,y):
    if not np.isnan(x):
        lon,lat=ccrs.PlateCarree().transform_point(x, y,ccrs.GOOGLE_MERCATOR)
        wind = state.data.where(
            (state.data.lon>=lon-wrf_spacing/111) &\
            (state.data.lon<=lon+wrf_spacing/111) &\
            (state.data.lat>=lat-wrf_spacing/111) &\
            (state.data.lat<=lat+wrf_spacing/111)
        ).mag.mean(dim=['south_north','west_east'],skipna=True).hvplot(
            x='Time',
            title=f'Wind Speed m/s ({lon:.4}, {lat:.4})',
            # responsive=True,
        ).opts(labelled=[],active_tools=[],shared_axes=False)
        wave = state.data.where(
            (state.data.lon_rho>=lon-roms_spacing/111) &\
            (state.data.lon_rho<=lon+roms_spacing/111) &\
            (state.data.lat_rho>=lat-roms_spacing/111) &\
            (state.data.lat_rho<=lat+roms_spacing/111)
        ).isel(s_rho=-1).mean(dim=['eta_rho','xi_rho'],skipna=True).hvplot(
            kind='line',
            x='ocean_time',y=['Hwave','mag','temp','zeta'],
            subplots=True,
            shared_axes=False,
            # responsive=True,
        ).cols(1)
        return (wind+wave).cols(1)
    else:
        return pn.pane.Str('Double-click on a plot to see the timeseries \n of each variable')

template.sidebar.append(side_plots)
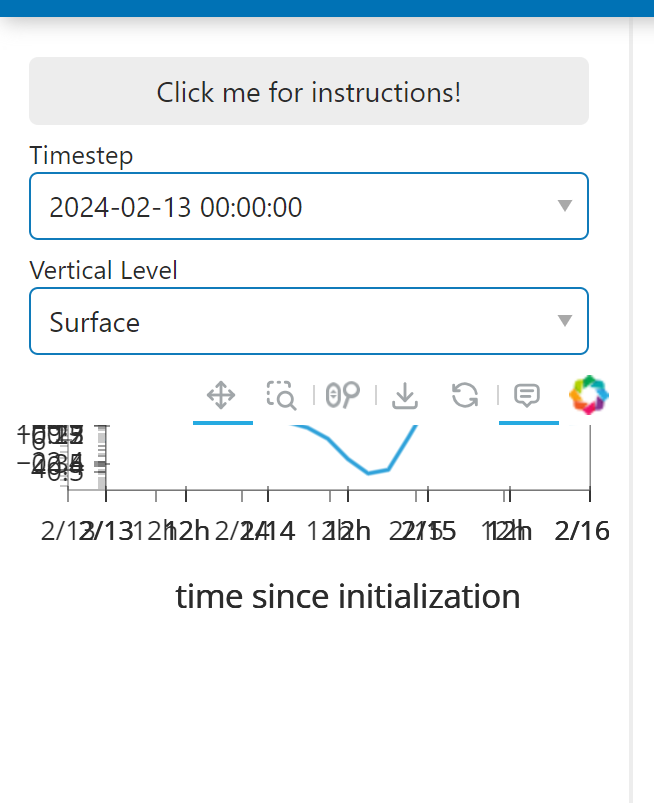
Here is the result without responsive=True
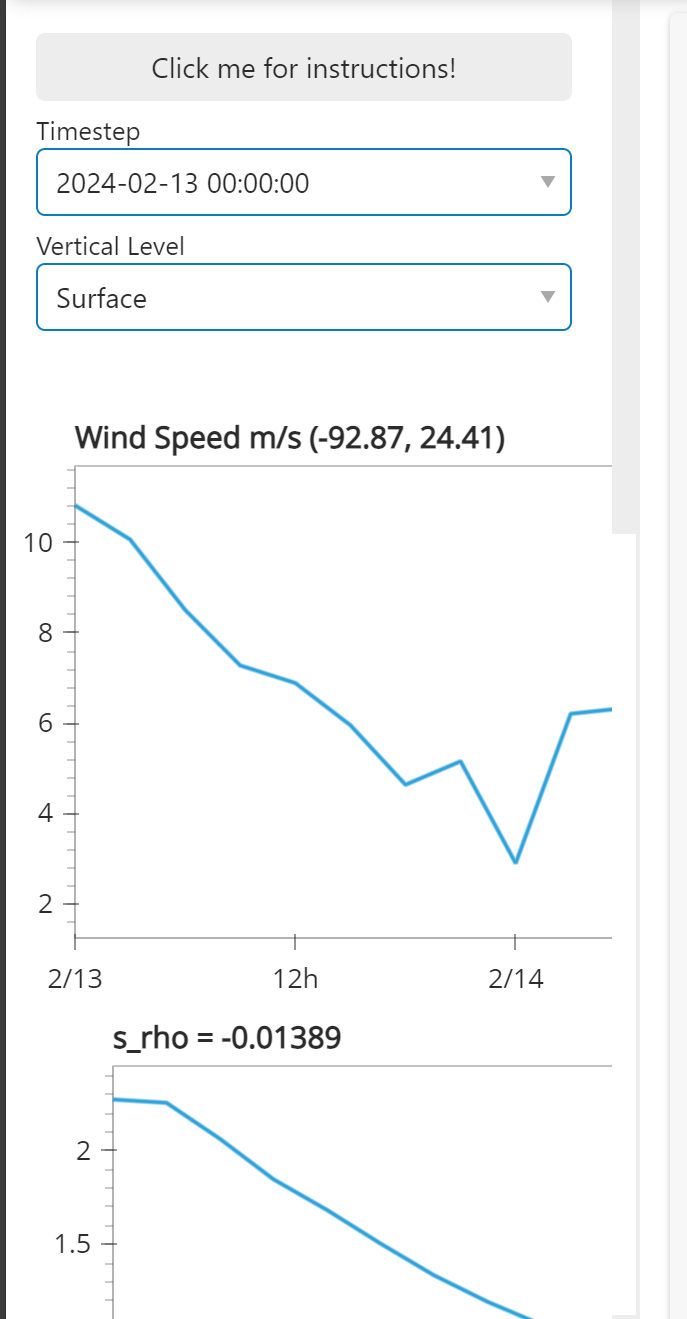
Here is the result with responsive=True