Plotting a grid with categorical and datetime dimensions

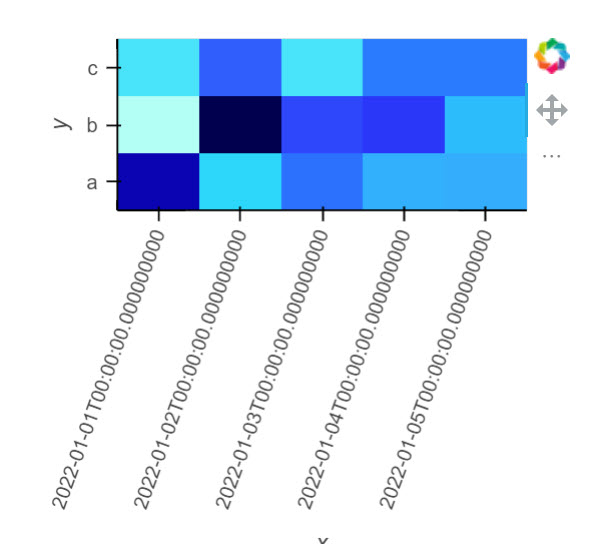
Hi. I’m trying to plot a grid with one categorical axis and one datetime axis. I’ve tried doing that using the xarray interface but it doesn’t seem to work, I get TypeError: cannot perform reduce with flexible type, because of the categorical dimension.

Another approach I tried is converting the categorical axis to integers, but then I’m not sure how to fix the ticks and the hover tool to show the actual categories.

What’s the best way to do this?

import xarray as xr
import holoviews as hv
import pandas as pd
import numpy as np

x = xr.DataArray(
    data=np.random.rand(3, 5), dims=("id", "date"),
    coords={
        "id": ["a", "b", "c"], 
        "date": pd.date_range("2022-01-01", periods=5, freq="D").values.astype('<M8[ns]')
    })

hv.Image(x).opts(
    tools='hover',
)
1 Like

Hi @ronif

I cannot run your example. I get the exception

Traceback (most recent call last):
  File "C:\repos\private\awesome-panel\script.py", line 13, in <module>
    image = hv.Image(x).opts(
  File "C:\repos\private\awesome-panel\.venv\lib\site-packages\holoviews\element\raster.py", line 287, in __init__       
    l, r, xdensity, _ = util.bound_range(xvals, xdensity, self._time_unit)
  File "C:\repos\private\awesome-panel\.venv\lib\site-packages\holoviews\core\util.py", line 1976, in bound_range        
    low, high = vals.min(), vals.max()
  File "C:\repos\private\awesome-panel\.venv\lib\site-packages\numpy\core\_methods.py", line 44, in _amin
    return umr_minimum(a, axis, None, out, keepdims, initial, where)
numpy.core._exceptions.UFuncTypeError: ufunc 'minimum' did not contain a loop with signature matching types (dtype('<U1'), dtype('<U1')) -> None

Could you upload an example that can run with the latest version of HoloViews and numpy? Thanks.

Got intrigued: the question boils down to changing the axes of Image.
I have not succeeded…

import xarray as xr
import holoviews as hv; hv.extension("bokeh")
import pandas as pd
import numpy as np

x = xr.DataArray(
    data=np.random.rand(3, 5), dims=("id", "date"),
    coords={
        "id": ["a", "b", "c"], 
        "date": pd.date_range("2022-01-01", periods=5, freq="D").values.astype('<M8[ns]')
    })
if False:
    h=hv.Image((x.date,x.id,x.data)).opts( tools=['hover'])
else:
    h=hv.Image(x.data).opts( tools=['hover'])
h

One could play with ticks ( see HoloviewsPlayground/CurvesAndPaths.ipynb at master · ea42gh/HoloviewsPlayground · GitHub for examples ), e.g.,
h=hv.Image(x.data).opts( tools=['hover'], xrotation=45, xticks=[(0.25*(i-1),x.date.data[i]) for i in range(4)])

 h=hv.Image((range(len(x.date.data)), range(len(x.id.data)), x.data)).opts( tools=['hover'], xrotation=70, xlim=(-0.5,len(x.date.data)-0.5), xticks=list(enumerate(x.date.data)),
                                                                                                              ylim=(-0.5,len(x.id.data)-0.5),     yticks=list(enumerate(x.id.data)))

comes a bit closer. The label position for x=0 is off (possible bug?)…

Hi @Marc and @ea42gh

Thanks for the reply!

I would say that the exception is the issue, or at least part of it. The exception you get is generated because hv.Image cannot set the bounds for the id axis, which is categorical (a list of strings).

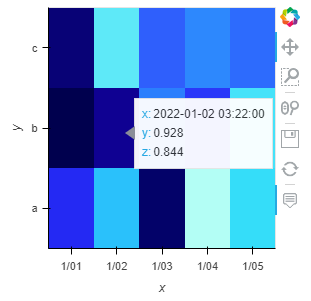
One approach to overcome that issue is to set the x dimension do an integer range, like @ea42gh did (i.e., pass range(len(x.id)) as the y-dim instead of x.id):

hv.Image((x.date ,range(len(x.id)), x.data)).opts(tools=['hover'], yticks=list(enumerate(x.id.data)))

But then you need to carefully set the y-ticks, and the hover tools doesn’t show the category:

image

I would’ve assumed there’s some standard way to get a plot with correct axes and hover values…

1 Like

so now you’d have to define a bokeh.model.HoverTool
There ought to be a better way. Personally,
I just got intrigued enough to try to get it working…

And a HoloViews HeatMap won’t work for your application? A HeatMap should support categorical axes already.