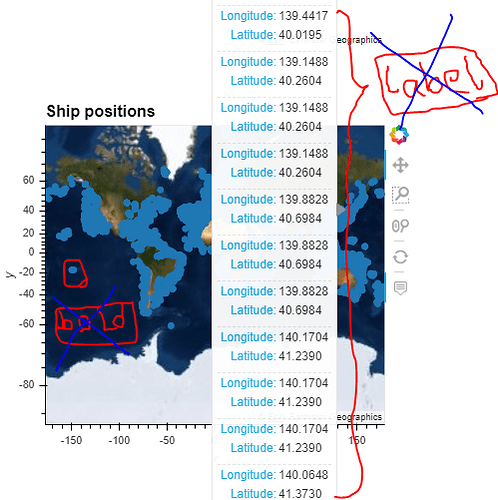
I have a large dataset of AIS data ( position of ships in the world with millions geodataframe point) I want to map them with tile = ESRI map in hv plot:
show(hv.render(points_gdf.hvplot(geo=True, title=‘Ship positions’,tiles=‘ESRI’).opts( width=1200, height=800)))
. when I render them using show function from “bekh”, I can see the plot of points but it is very slow and I cant zoom in. It takes a lot of time to process and frequently I get the error in my browser that “do you want to wait”
Moreover, it shows the X and Y position of each point when I go over the point which is useless for me and I guess makes the process slower as when I go over them, it seems to be slower.
1- How can I deactive the point detail when I go over the point so that don’t show the point position?
2. the points are very bold and I want them to be less bold in that map.how can I handle that?
2. what do you suggest me to map the points so that when I save the rendered HTML file, It covers all points when I zoom and could work static( I mean if I send the file to others they can see all points in the map and zoom in)
Here is the sample of a picture.
Your help would be appreciated.
