pn.pane.HoloViews not rendering consistently across different layouts

I am experiencing inconsistent rendering of the HoloViews object contained on this page:
https://panel.holoviz.org/reference/panes/HoloViews.html

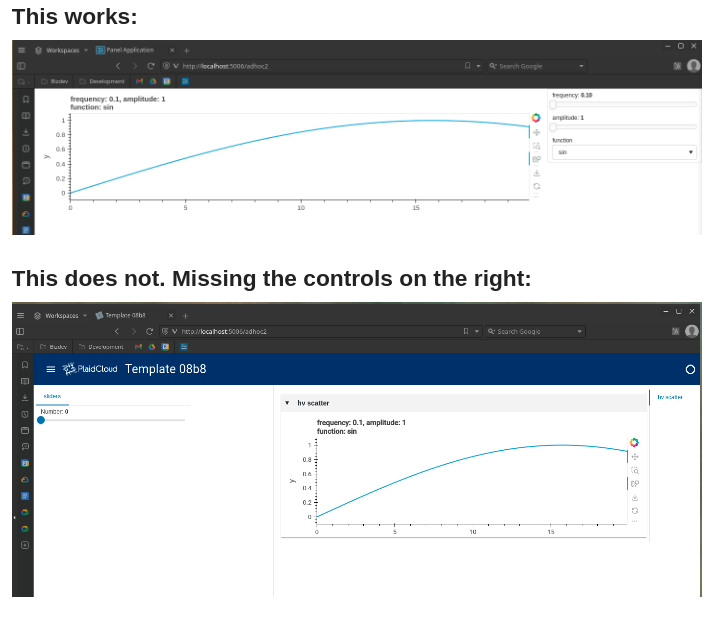
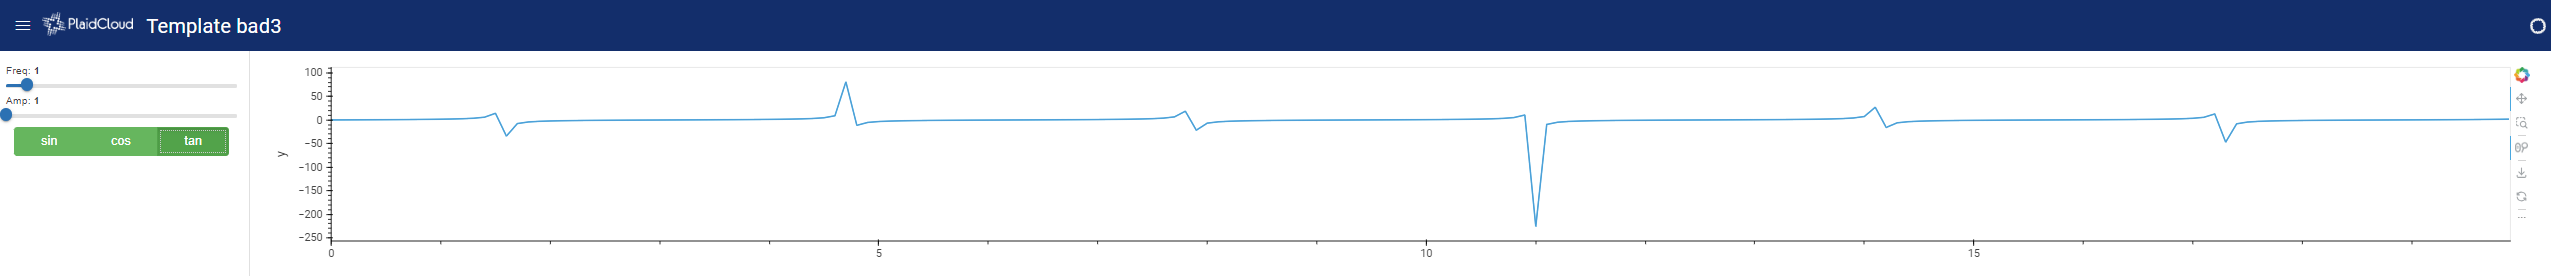
This code should display a chart and then three controls, a frequency slider, an amplitude slider, and a selectbox containing [sin, cos, tan]

The original code is as follows:

import pandas as pd
import hvplot.pandas
import holoviews.plotting.bokeh

def sine(frequency=1.0, amplitude=1.0, function='sin'):
    xs = np.arange(200)/200*20.0
    ys = amplitude*getattr(np, function)(frequency*xs)
    return pd.DataFrame(dict(y=ys), index=xs).hvplot(height=250, responsive=True)

dmap = hv.DynamicMap(sine, kdims=['frequency', 'amplitude', 'function']).redim.range(
    frequency=(0.1, 10), amplitude=(1, 10)).redim.values(function=['sin', 'cos', 'tan'])

hv_panel = pn.pane.HoloViews(dmap)
hv_panel

My modified code

(Toggle the WORKS and DOES NOT WORK lines at the bottom to see the layout issue.)

#https://panel.holoviz.org/how_to/components/add_remove.html
import pandas as pd
import hvplot.pandas
import holoviews.plotting.bokeh
import panel as pn
import holoviews as hv
import numpy as np
import uuid

def sine(frequency=1.0, amplitude=1.0, function='sin'):
    xs = np.arange(200)/200*20.0
    ys = amplitude*getattr(np, function)(frequency*xs)
    return pd.DataFrame(dict(y=ys), index=xs).hvplot(height=250, responsive=True)

dmap = hv.DynamicMap(sine, kdims=['frequency', 'amplitude', 'function']).redim.range(
    frequency=(0.1, 10), amplitude=(1, 10)).redim.values(function=['sin', 'cos', 'tan'])

hv_panel = pn.pane.HoloViews(dmap)

slider1 = pn.widgets.FloatSlider(
    name='Number',
)

my_id = str(uuid.uuid4())[:4]
print(my_id)

template = pn.template.MaterialTemplate(
    title='Template {}'.format(my_id),
    sidebar=[
        pn.Tabs(
            pn.Column(slider1, name='sliders'),
        )
    ],
    sidebar_width=500,
    logo='https://github.com/rea725/superset-images/blob/main/plaidcloud-white.png?raw=true',
    favicon='https://plaidcloud.com/wp-content/uploads/2021/10/cropped-favicon-32x32.png',
    header_background='#002F6C',
)

template.main.append(
    pn.Row(
        pn.Tabs(
            pn.Card(hv_panel, title='hv scatter', name='hv scatter', sizing_mode="stretch_both"),
            tabs_location='right',
        ),
    ),
)

if pn.state.served:
    #WORKS:
    #hv_panel.servable()  # This works.  I get the controls (frequency, amplitude, function).
    
    #DOES NOT WORK:
    template.servable() # This does not work.  I get the chart but not the controls.

I have modified the code as follows, I’ve included this as the contents within a panel.Tab object contained in the main pane of a panel.template.MaterialTemplate object. When I do this, the chart renders, but the controls on the right no longer show up.

I don’t know if this is the answer you are after and I certainly can’t speak for the exact reason why this occurs but I was able to get them to appear on the right just by removing the pn.Card.

template.main.append(hv_panel)

Personally I use param for all of my widgets as I find that provides the best level of control for me. If you are trying to place your controls in the sidebar then I would suggest checking it out.

# https://panel.holoviz.org/how_to/components/add_remove.html
import pandas as pd
import hvplot.pandas
import holoviews.plotting.bokeh
import panel as pn
import holoviews as hv
import numpy as np
import uuid
import param


class App(pn.viewable.Viewer):
    freq = param.Number(default=1, bounds=(0.1, 10))
    amp = param.Number(default=1, bounds=(1, 10))
    func = param.ObjectSelector(objects=["sin", "cos", "tan"], default="sin")

    def __init__(self, **params):
        super().__init__()

    @pn.depends("freq", "amp", "func")
    def sine(self):
        xs = np.arange(200) / 200 * 20.0
        ys = self.amp * getattr(np, self.func)(self.freq * xs)
        return pd.DataFrame(dict(y=ys), index=xs).hvplot(height=250, responsive=True)

    @pn.depends("freq", "amp", "func")
    def create_layout(self):
        my_id = str(uuid.uuid4())[:4]
        print(my_id)
        widgets = {
            "func": {
                "type": pn.widgets.RadioButtonGroup,
                "name": "Plot Function",
                "button_type": "success",
            }
        }

        self.template = pn.template.MaterialTemplate(
            title="Template {}".format(my_id),
            sidebar=[self.param.freq, self.param.amp, pn.Param(self.param.func, widgets=widgets)],
            sidebar_width=320,
            logo="https://github.com/rea725/superset-images/blob/main/plaidcloud-white.png?raw=true",
            favicon="https://plaidcloud.com/wp-content/uploads/2021/10/cropped-favicon-32x32.png",
            header_background="#002F6C",
        )

        self.template.main.append(self.sine)


if pn.state.served:
    pn.extension(sizing_mode="stretch_width")
    app = App()
    app.create_layout()
    app.template.servable()


1 Like

Thanks @killcoder.

I like that you turned it into a class & I definitely appreciate your recommendation to use param for all widgets.

Right now, I’m really just trying all of the tools in the toolbox, and learning as I go.

1 Like