When doing a scatter plot with point size dynamically based on data frame values, e.g.
df.plot.scatter(x='a', y='b', s='c', scale=25)
The above was borrowed from the examples in the docs Pandas API — hvPlot 0.8.1 documentation
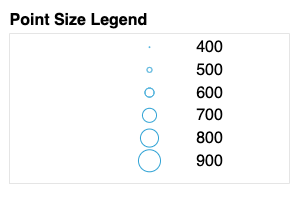
It would be show in the legend the point sizes. I built my own but its based on labels and plotting without showing axes. Is there a better solution?
1 Like
Hoxbro
2
This is not possible with the Bokeh backend, see this issue.
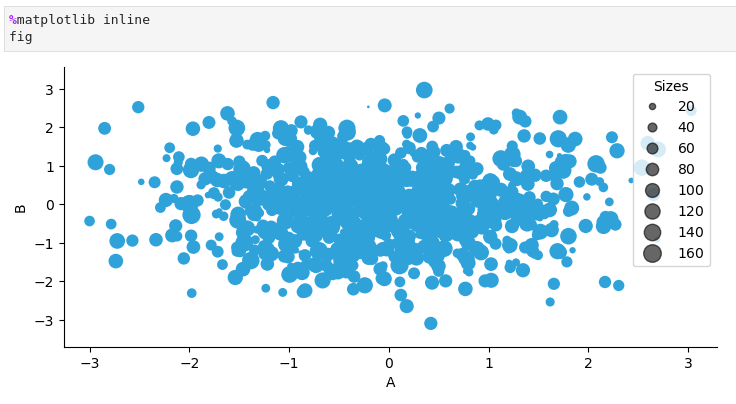
It can be done with matplotlib, here is a very rough implementation of how to do it. Inspiration was found ħere,
import numpy as np
import pandas as pd
import holoviews as hv
hv.extension("matplotlib")

pd.options.plotting.backend = 'holoviews'

ts = pd.Series(np.random.randn(1000), index=pd.date_range('1/1/2000', periods=1000))
df = pd.DataFrame(np.random.randn(1000, 4), index=ts.index, columns=list('ABCD'))
df.C = df.C.abs()

# Could properly be added to a hook
fig = hv.render(a)
ax = fig.get_axes()[0]
scatter = ax.get_children()[0]
handles, labels = scatter.legend_elements(prop="sizes", alpha=0.6)
legend = ax.legend(handles, labels, loc="upper right", title="Sizes")