pgierz
December 16, 2019, 1:03pm
1
Hi,
I’m trying to add the location of several Greenland Ice Cores on top of some other data I have. So far, I have this:
ice_cores_in_greenland = pd.read_csv("/isibhv/projects/paleo_work/pgierz/coupled_ice_paper/GrIS_Core_Locations.csv", sep=";")
import hvplot.pandas
ice_cores_in_greenland.columns = ["Name", "Longitude", "Latitude"]
#df.hvplot.labels(x='Longitude', y='Latitude', text='City', text_baseline='bottom', hover=False)
core_points = ice_cores_in_greenland.hvplot.points(x="Longitude", y="Latitude", color="lightblue", marker="s",
                                                   project=True, projection=proj, geo=True, coastline=True)
core_labels = ice_cores_in_greenland.hvplot.labels(x='Longitude', y='Latitude', text='Name',
                                                   hover=False, project=True, geo=True,
                                                   projection=proj)
cores_plot = (core_points * core_labels)
cores_plot
The actual content of the DataFrame is:
# Name; Longitude; Latitude
NEEM; -51.06; 77.45
NGRIP; -42.32; 75.1
GRIP; -37.565333; 72.579
Camp Century; -61.1333; 77.1667
DYE-3;  -43.816667; 65.183333
Renland; -26.72; 71.30
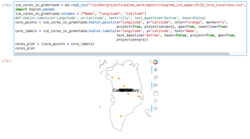
However, the result looks like this:
I suspect something is not correct in the hvplot.labels part, which I guess is just calling some Geoviews functions in the background.
jbednar
December 17, 2019, 1:14pm
2
I can’t replicate it without the data file and “proj”; have you tried it without “proj”? I.e. is it a failure in projection?
pgierz
December 17, 2019, 1:38pm
3
Sorry, I should have given a complete example…
import pandas as pd
import cartopy.crs as ccrs
import hvplot.pandas

from io import StringIO

data = StringIO("""
NEEM; -51.06; 77.45
NGRIP; -42.32; 75.1
GRIP; -37.565333; 72.579
Camp Century; -61.1333; 77.1667
DYE-3;  -43.816667; 65.183333
Renland; -26.72; 71.30
""")

ice_cores_in_greenland = pd.read_csv(
    data, sep=";"
)


ice_cores_in_greenland.columns = ["Name", "Longitude", "Latitude"]


proj = ccrs.Orthographic(-40, 73)

core_points = ice_cores_in_greenland.hvplot.points(
    x="Longitude",
    y="Latitude",
    color="gray",
    marker="o",
    fill_color="red",
    size=60,
    project=True,
    projection=proj,
    geo=True,
    coastline=False,
)
core_labels = ice_cores_in_greenland.hvplot.labels(
    x="Longitude",
    y="Latitude",
    text="Name",
    hover=False,
    project=True,
    geo=True,
    projection=proj,
)
cores_plot = core_points * core_labels
cores_plot
The only projection that seems to work is PlateCarree
jbednar
December 24, 2019, 8:34pm
4
Thanks for the complete example! I’m a bit confused by it, though; when I run it using recent versions of the packages I get KeyError: 'Longitude', not a messed up plot. To me that looks like a bug in our projecting code, because the dataframe and HoloViews dataset clearly do have a Longitude field. If I comment out the projection lines in both, I can replicate the plot you showed, which seems to indicate that the points are being projected but the labels all end up at 0,0. I’d recommend filing this as a bug report at https://github.com/holoviz/geoviews/issues .
Seems to be an hvPlot issue, looks like it’s not actually respecting the geo and project arguments. So please file it there, not on geoviews.