I’m been trying to generate polar plots to add them into my panel applications. I have tried many different packages (bokeh, holoviews, plotly etc.) without any luck.
Below is a minimum working example using plotly
import numpy as np
import panel as pn
import plotly.graph_objs as go
pn.extension("plotly")
# hv.extension("plotly")

fig = go.Figure()
fig.add_trace(
    go.Scatterpolar(
        r=np.random.uniform(low=-20, high=10, size=(360,)),
        theta=np.arange(-180,180),
        fill="toself",
        fillcolor=None,
        line_color="green",
    )
)
fig.update_layout(polar=dict(radialaxis=dict(visible=True)))
fig.show()
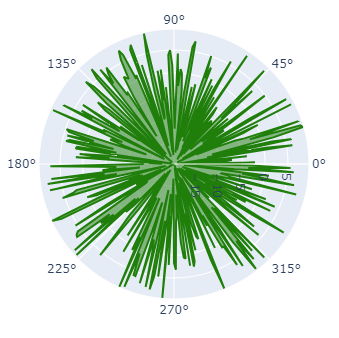
Showing the plotly figure directly produces the desired polar plot.
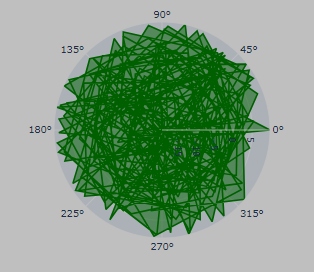
After lots of trial and error I finally got Matplotlib to generate the required plot so that it could be added to panel.
# Importing the required modules
import matplotlib.pyplot as plt
import numpy  as np
import pandas as pd
import panel as pn
pn.extension()

r = np.random.uniform(low=-20, high=10, size=(360,))
theta = np.arange(-180, 180)

# Creating a new figure and setting up the resolution
fig = plt.figure(dpi=200)

# Change the coordinate system from scaler to polar
ax = fig.add_subplot(projection='polar')

# Generating the X and Y axis data points
theta = np.deg2rad(theta)
# theta = np.deg2rad(np.arange(-180,180,1))

# plotting the polar coordinates on the system
plt.polar(theta,r,)

# Setting the axis limit
ax.set_ylim(-30,10)

# Displaying the plot
# plt.plot()
pn.Column(fig)