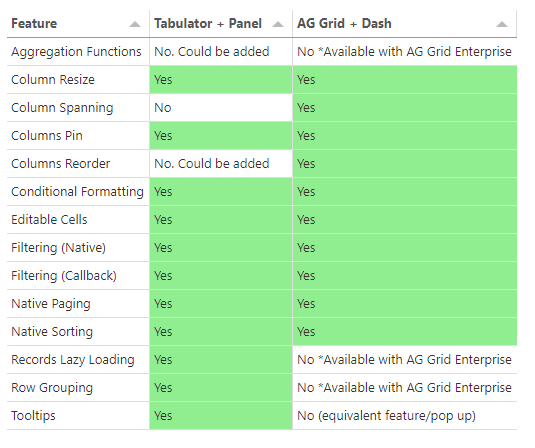
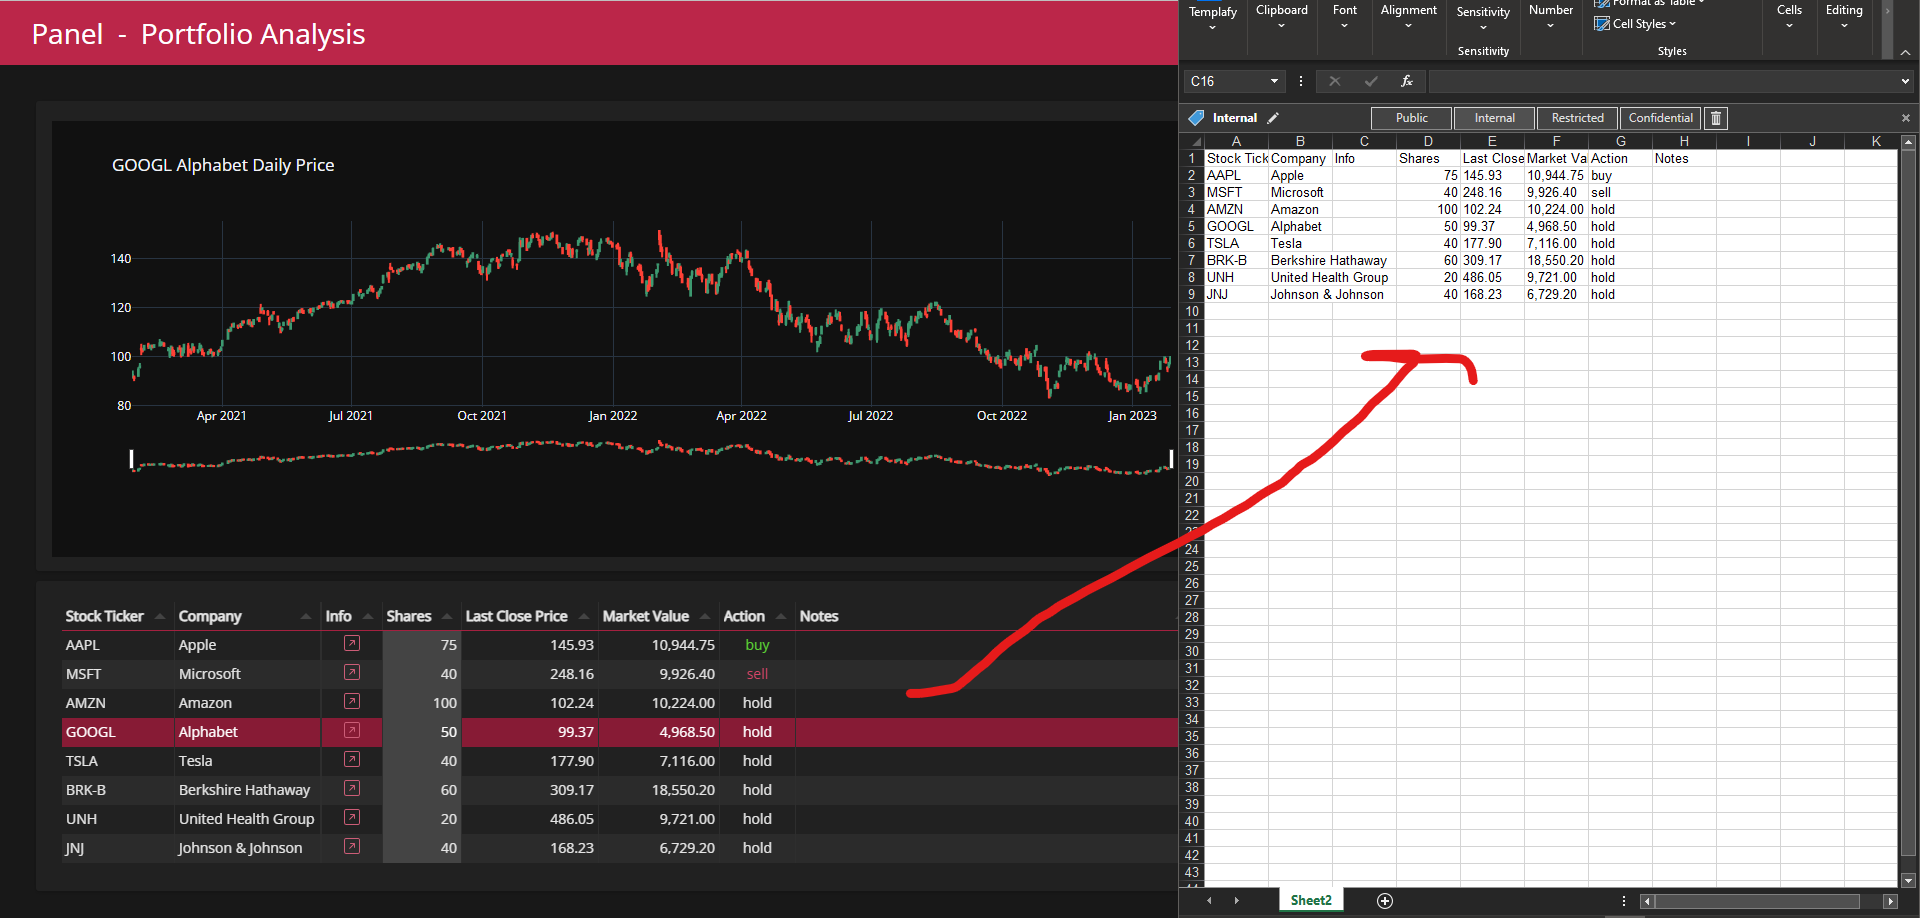
I’ve started contributing an example to the Panel gallery with an excel like interactive table. You can edit cells which then updates other cells. You can select rows which then updates plots.
Any ideas for improvements are appreciated. What would you like to see?
@Marc , Import and export csv buttons would be slick. One thing I like about JSpreadsheet over Tabulator is the ease with which you can copy and paste cells. An import function is probably the next best thing.
Yes, my understanding is that Tabulator copy and paste is wholesale only, not individual cells. FYI, I haven’t really had to time to work on the JSpreadsheet extension. I posted this ages ago: JSpreadsheet , but it needs a lot of work.
This is great again, though my trading platforms keep records of buys and sales etc I tend to keep another sheet with this info that combines everything I can see this taking its place, I don’t know how feasible or if should be included but…
Some possible features that I’m thinking of
Ability to change candle time or select download time frame if poss
Ability to easily log buy in and sell out price, percent made lost, maybe I bought in at two different prices at two different dates just to be super complicated
Ability to highlight the above trades on graph at a click so I can quickly see my reasoning behind buy in
Show investment percentage change for quick gauge on the good bad and ugly choices I’ve made
Crosshair hover info of candle maybe
A box to note platform trade carried on, notes is probably fine, I was thinking an auto select drop down but could be about half a million avenues here
Ability to log trade fee - maybe this could indicate what min % change is required to sell for break even
Generally I’m a buy low sell high but what about the shorters… Do you just work with negative percents as a positive
Save load ability for safe keeping
I have been working on something which merges CSV trading records from IBKR, HL and ii in the UK, historical market data from IBKR, and doing some UK Tax calculations which the platforms can’t do independently. I’m currently trying to attach it to a Panel UI. Can’t really share until I’ve removed any trace of my account data from the git log
I’m new to Panel and currently I’m trying to get the formatting up to a similar standard to plain-old Pandas in Jupyter (familiar territory), along with the dashboard / liveness of Panel, and in Dark mode of course I’m slightly finding the Panel gallery a bit short of spreadsheet / datagrid / DataFrame examples, with nice formatting, so I’m hoping Marc’s example here will fill this gap.
(PS when I say Panel, I kind of mean the Panel family of libraries - I’m not yet really able to differentiate between them.)
Hi Marc - I’m very pleased to have stumbled on Panel recently, thanks for sharing your work.
If I may just ask a dumb question -
Like your example, I’m using Tabulator to display the dataframe since that seems to be the most flexible / up-to-date way (although I’m not looking for editing right now). What would be the recommended way to trigger an update of the dataframe contents? (I have a button and can use on_click - but what should I call on the Tabulator? I can’t see trigger / update methods)
For now I would be equally happy just replacing the whole dataframe - no need to do granular updates.
I have a pd.DataFrame underlying it. I have a couple of controls - a bit like your filtered dataframe example. But the filtered example just seems to pass a pandas dataframe directly to Panel / Column. I struggled to see how to apply a bunch of formatting and dark theme to that.
This (very nice) portfolio example doesn’t seem to have any other controls which would cause the Tabulator to update; although it does of course support direct user editing of some of the cells.
I’m not wedded to Tabulator, but I do very much want control of the text formatting using Python, decimal / date formatting / alignment etc (pandas / “pd.DataFrame.style” formatting would be easiest but I can learn the bokeh formatters). I need the table to be compact / nicely formatted (like the Pandas/Jupyter formatting), and I really want to stick with a dark theme Regarding CSS I am really a cut-and-paste jockey, I can do minor mods, but I don’t yet understand how it all fits together.
hi @Marc , kindly please advise is it possible when user click cell edit ,change the value then will update as well dataframe not only display in the dashboard. I saw your below code:
patches = pn.widgets.IntInput(description="Used to raise an event when a cell value has changed")

def handle_cell_edit(event, table=summary_table):
    """Updates the `value` cell when the `quantity` cell is updated"""
    row = event.row
    column = event.column
    if column == "quantity":
        quantity = event.value
        price = summary_table.value.loc[row, "price"]
        value = quantity * price
        table.patch({"value": [(row, value)]})

        patches.value +=1
Hi @Marc,
Were you able to get this working?
I’m trying to create a multi row multi column input area on a panel dashboard, that can automatically add rows based on the clipboard data size, to allow users to paste data, and then use table.value to capture it.
But I can’t get the paste operations working.