Porting a Bokeh app to Panel: tell me about all your cool things I should be using

I am writing a Bokeh app for running simulations and browsing/visualizing the results. It works okay, but has a few pain points. I’d love to be sold on the holoviz ecosystem.

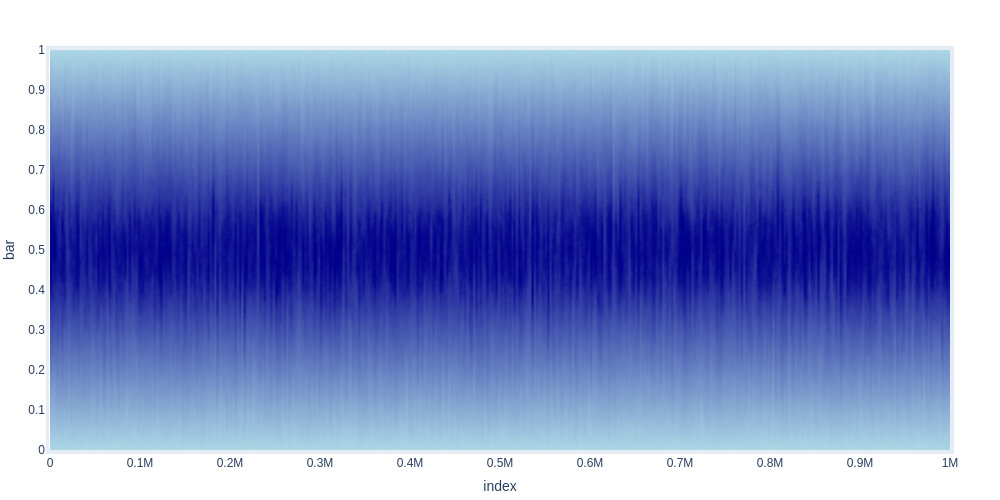
  • The plotting becomes slow at 1M+ points
  • Not so great support for adding/removing plots
  • Lack of error reporting
  • Difficulty applying non-standard style/layout
  • No good support for a multi-step app
  • ColumnDataSource doesn’t allow data processing

Here is the source code: Pyttoresque/main.py at main · NyanCAD/Pyttoresque · GitHub
And here is a demo video: https://twitter.com/pepijndevos/status/1496108136725454853

It seems like Datashader is the place to be for plotting big data, but my requirement is that the plot can be zoomed interactively, and that it supports streaming data. I’ve been told hvPlot supports this, but the docs are a bit sparse on the subject. I think I should be able to use streamz and set rasterize=true on hvPlot?

My current architecture uses a Capnproto simulation server that streams data to the client. This is currently using ColumnDataSource, but that’s more of a visulalisation structure. In the end I will want to implement data processing as well. It’s worth noting that the simulation data has a variable timestep, and requires interpolation for many types of processing. If there are cool things I should be doing with interp1d, streamz, dask, hdfs, spark or what have you that will help me stream, process, and plot large datasets, I’d love to hear it.

As you can see in the video my app has a bunch of tabs, two pages, and a lot of traces that can be selected. It was quite a pain to get this to work on Bokeh. If there are things in Panel that make this type of app easier to write, please share. Looking around the docs a bit, it looks like templates and pipelines could be useful, but they don’t quite seem to combine in the way I need. The modal seems neat for error reporting, but the static sidebar doesn’t seem to combine well with tabs/traces and a pipeline. Maybe I should use a heavily customised template and pipeline layout for this? Or something else I’ve missed.

Last question is, how hard is it to port a Bokeh app to Panel? It looks like Panel is based on Bokeh and inherits much of the same column/row/grid and widgets. Anything particular to pay attention to? Maybe I should have used Panel from the start but the docs really did not get across what it has to offer over plain Bokeh.

Hi ! great post and work, I will take a look at your AC simulation tool in the weekend, I use ngspice with pyspice and panel to simulate AC circuits, but it does not have an integrated circuit editor as you show in the video.

On your question, all the points you mentioned in the list are solved with panel and datashader. Making a full dashboard is easier with panel, you can integrate matplotlib, plotly,( and a lot of other python tools), the dashboard can be populated dynamically. The templates are a great addition too. If you only need some bokeh plots to be updated with a cds, one can go with bokeh only. However, Panel put on top of bokeh a lot of more packages and tools to make a full-stack dashboard with python comparable to most popular front-end libraries, without touching javascript.

3 Likes

Thanks! I’ve been making large changes to the editor, so I hope by the weekend the simulation tool is maybe back in sync. But if I’m porting it to Panel maybe not.

So far what’s driving me to change is the hvPlot, Datashader, Streamz stuff, not so much Panel itself. I’m just really puzzled by it, because everyone is saying it’s great and super powerful, but I’m not really seeing it yet. Some minor additions to what Bokeh offers as far as I can tell. Integration with hvPlot would be my main reason for switching.

In terms of actually building dashboards, it seems to be based around exactly the same row/column primitives with the same widgets and the same type of binding stuff. Which is part of the reason why I’m posting here. What’s so great that I should be using? What’s the part that’s more powerful than Bokeh?

The Pipeline thing seems kinda nice, but not life-changing. It’s kinda similar to what I made with my Wizard class. Templates could be nice, although as I said, not sure how to use them for my case without heavy customization. So to me it really seems like the main reason is that you can use other plotting libraries.

Bokeh is great, but you can use bokeh plot, tables and widgets without building a custom bokeh extension. I only use panel (not all the other libraries) because in our lab we needed build a dashboard with some plots done with plt.imshow of matplotlib and others with bokeh. But additionally to all the plotting libraries you can use, you can try the reactiveHTML component, where you can use whichever javascript library with little effort. Sure other people can give you good reasons about datashader, hvplot, etc… In any case, you have to find the appropriate tool for what you need to do.

Great post @pepijndevos

The thing I would like to learn here is about performance. I have in the past seen some high performing, streaming Bokeh apps. I have not seen that in so many other places.

As Panel is built on Bokeh I would expect it to be possible to achieve same or near the same performance. But maybe there are issues that need to be ironed out before getting there??

I guess I’m about to find out. Issues with performance when streaming millions of points is actually what drove me here, because it seemed like refreshing the plot took more CPU than the entire simulation. The plot would basically be frozen, and then continue updating long after the simulation was done.

It was quite a tricky thing to get working at all, so I’m really eager to find out how Panel will handle it. A rough overview of the process:

There is a SimRunner background thread that fetches the schematic from the database, and monitors it for changes. (there is an option to automatically re-run)

Capnproto and Bokeh both really don’t like to be talked to from random threads, so once a schematic is retrieved from the database, add_next_tick_callback schedules running the simulator and updating the plots on the main thread.

A tricky thing I’m not even sure I’m doing correctly now is that these callbacks are unordered. At first I ran Capnproto from another thread, pushing updates in next tick callbacks, but then my updates would stream out of order. Now Capnproto is basically running in a blocking way in the next tick callback, which I’m not 100% sure actually updates the plot as it goes, or just queues an entire simulation worth of updates that all run once the simulation is done, because as I said, once I run longer simulations it actually becomes really slow.

I do a bit of cooperative multithreading by making my streaming functions yield and interleaving them with more_itertools.roundrobin, and then call update_traces which is very ugly for two reasons: It’s not known ahead of time exactly what columns the datastreams will contain. It returns a map of ColumnDataSources, and compares that against the current plots and checkboxes for selecting traces. If there is a new set of data, it adds it, but it gives up pretty quickly and resets everything to avoid weird ghost checkboxes and the like.

This map of CDS structure is also a bit hacky when it comes to restarting a simulation. In this case you can hope the returned vectors are the same and just truncate the CDS, so you maintain the rest of the UI state. But then if the columns are different you have to throw it all out anyway.

As a first step I’m currently porting the Capnproto stuff to Streamz, and just try it out in a notebook with hvPlot. A prerequisite for going any further is that the Streamz+Datashader stuff actually performs well.

I guess I’ll need to find out how to hook up this dict of Streamz DataFrames to hvPlot. Maybe I need to do some push_notebook thing, or look into Param for wrapping my dict so it updates the plot? If I can clean up that dict of CDS mess with Param, that would be a total game changer.

Another thing I could look at if it would greatly simplify my life, is running Capnproto on asyncio. Bit of boilerplate, but if it makes the streaming much more straightforward and responsive, that might be worth it: Quickstart — capnp 1.0.0 documentation

Ok so right off the bat Streamz doesn’t work the way I want it to work. It really acts as a view into the river of data flowing by, while the data just streams into the void. Compared to ColumnDataSource which accumulates the data.

It seems the hvPlot is where the data accumulates if you plot the streamz DataFrame, but this doesn’t work if you create a plot once the simulation is already underway or completed. So far I’m only getting empty plots with small examples. It also precludes any post-processing on the data.

As I explained, it is not known ahead of time exactly which vectors the simulator returns, and which the user wants to plot. The user might want to toggle some traces on and off. None of this works if Streamz just streamz the data into the void.

I tried playing with buffer, but so far no luck.

Long story short, it seems like Streamz is designed for continuous streams of data, while what I have is a finite stream of data that I want to plot as it comes in, but once it is received, treat as a normal DataFrame.

I tried looking around a bit if there is anything more like CDS in the Holoviz ecosystem, but so far no luck. The Dask docs mention something about streaming, but basically say “use futures” which seems yet another completely different usecase.

1 Like

Oh god it gets worse. So if you run the simulation once, make the plot, and then run it again so it uses the stream that’s already tied to a plot, you can actually get it to plot something, and by controlling the backlog you can get it to actually show some reasonable amount of data.

And then I set rasterize=True… it seems to only plot the tiny sliver of data of the current update (you can see the blue line slide from 0 to 1)

Absolutely useless. Suffices to say we’re not off to a great start.

Holoviz branch of my app: GitHub - NyanCAD/Pyttoresque at holoviz
Code:

from pyttoresque.simserver import *
import hvplot.pandas
import hvplot.streamz
pd.options.plotting.backend = 'holoviews'
###
d = {}
###
con = connect("localhost")
fs = loadFiles(con, "test.cir")
res = fs.commands.tran(1e-6, 1, 0)
for _ in stream(res, d):
    pass
###
d['Transient Analysis'].hvplot(backlog=10000, rasterize=True)

(I need to rerun the second to last cell to see anything)

1 Like

Hi @pepijndevos

Great to see some smaller code. But its not code I can run. For me its simply either impossible or too time consuming to support in my spare time if I don’t get code that can run or I can quickly see how to get running.

So please make your code very specific, small and reproducible. I know it takes time. But its needed. From the answers to the small examples you should hopefully be able to build your larger application.

You are of course completely correct. I illustrated the problem without any easily runnable code.
I’ve created a gist and colab with a self-contained notebook that does pretty much the same thing.
Not sure if there is a better way to share notebooks, neither of them show the embedded plots.

I guess you’ve already seen that but share it anyway for anyone looking at this, hvPlot provides a simpler API to the HoloViews, GeoViews and Datashader. The HoloViews docs about streaming data is a little more detailed: Working with Streaming Data — HoloViews v1.14.8

1 Like

Okay I’ve been messing with HoloViews directly this morning, and it’s definitely working much better, but it’s not quite there yet. Part of that seems to be bugs/limitations, part just me not knowing how to do things.

Buffer definitely is the key to accumulating the results, and with some copy-pasting from the streaming and big data user guide, I managed to plot one trace of the DataFrame.

Some issues I’m still having

  • Plotting becomes slower as data grows bigger (looks like it redraws everything)
  • With rasterize/datashade plot bounds do not update (bug?)
  • I don’t seem to be able to draw multiple traces overlaid

I guess plotting slowing down is to be expected unless Datashader can do partial updates. I think it’s not tooo bad because the simulator will run in another process, so it’ll just do larger updates and not actually slow down. The good thing is the CPU usage is now in the Python process so the UI stays snappy.

Worth noting that in my experience Plotly’s scattergl plot can also handle fairly large number of points, much faster than Bokeh. So if Plotly can do partial updates and I can use the WebGL backend that could be another option.

If I do not use Datashader, clear the Buffer, make a fresh plot, and rerun the “simulation”, the bounds update continuously. But with Datashader, the bounds stay at 0…1 and do not update. This seems like a clear bug. If I only clear the buffer but not rerun the plot, bounds stay at 0…1M and streaming works as expected.

[edit] datashade(curve_dmap, streams=[hv.streams.PlotSize]) makes it update the bounds

With regards to plotting multiple traces, I seem to be really struggling with all the concepts and interactions. Several times I tried to do things and it told me I can’t nest DynamicMap.

Some things that “work” but just doesn’t show the second trace:

hv.Curve(data, 'index', 'bar') * hv.Curve(data, 'index', 'foo')
hv.Curve(data, 'index', ['foo', 'bar'])

Based on the big data documentation I tried the following, but it gives some confusing error about mismatched indexes. I guess it wants either foo or bar as the y axis?

traces = {k: hv.Curve(data, 'index', k) for k in data.columns}
hv.NdOverlay(traces, kdims='trace') # what's kdims??
WARNING:param.dynamic_operation: Callable raised "ValueError("datasets must have the same data variables for in-place arithmetic operations: ['index_bar Count'], ['index_foo Count']")".
Invoked as dynamic_operation(height=400, scale=1.0, width=400, x_range=None, y_range=None)

But the big thing that I want to do is allow the user to select multiple traces from a long list of options.

It seems you can have a HoloMap that will allow you to tweak parameters, but there are two problems with this that I struggle with: it seems to require nesting things in a way it’s not happy about. The UI for selecting things is too simplistic.

So I’m guessing what I want is a DynamicMap that is based on both a Buffer and a Pipe and use a custom UI connected to the pipe to send in which traces to plot into a custom callable. But… how? Composing this stuff is a big mystery to me for now.

Updated minimal example:

I’ve update the gist with my latest changes.

It seems like the problem was that when plotting a dataframe it considers the column names the axis dimension, and it is not happy to plot multiple dimensions. I’ve had to artificially pass the X and Y values as a tuple and then give all of them the same dimension.

I’ve also figured out how to use events to update the plotted traces.

So now the only remaining issues are:

  • either the plot bounds follow the updates and zooming doesn’t rerender, or you can zoom all you want but plot bounds don’t update.
  • datashading looks really silly when you zoom in and the corners of the Curve are a different shade than the midpoints.

I kinda get why it works that way, but it’s not a good experience. I’ll make new topics for specific problems that come up when making the Panel app.

1 Like