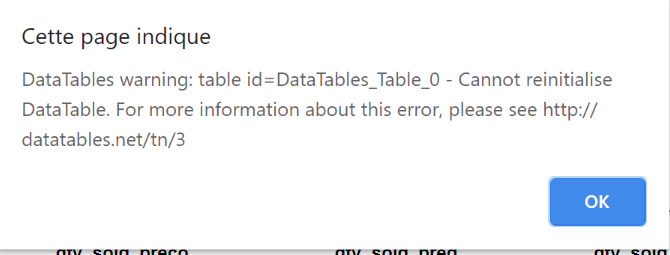
after 3 tries, the best option is change the script by
script = """
<script>
if (document.readyState === "complete") {
$('.example').DataTable({
"columnDefs": [
{"className": "dt-left", "targets": "_all"}
]
});
} else {
$(document).ready(function () {
$('.example').DataTable({
"columnDefs": [ {"className": "dt-left", "targets": "_all"} ]
});
})
}
</script>
"""
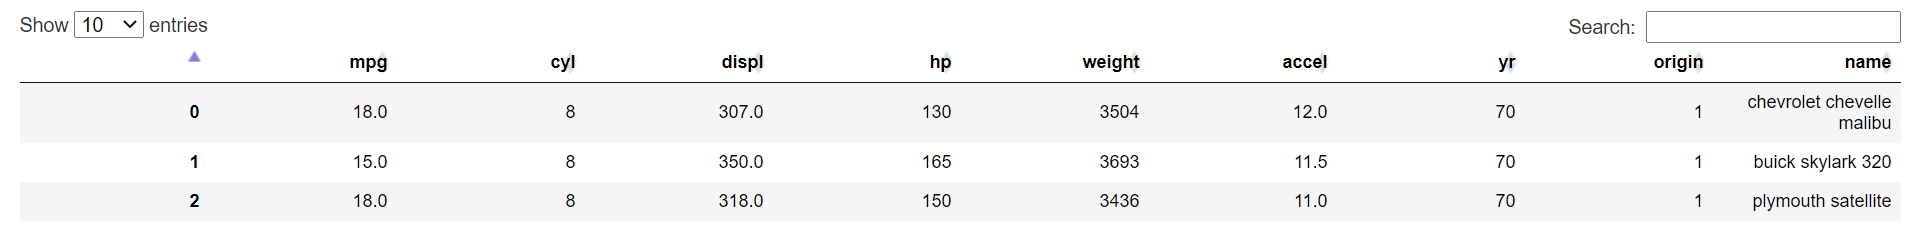
html = autompg.to_html(classes=['example', 'panel-df'])
pn.pane.HTML(html+script, sizing_mode='stretch_width').show()
as derived from https://datatables.net/manual/styling/classes
This solution works only if you use show or servable. In the notebook it doesn’t work.
For bidirectional communication one thing you can do is create a dummy slider, and you can change the value of the slider in javascript. In the code below you can see that doing click in the table in javascript the text value of python can be changed.
from bokeh.models.widgets import Slider
slider =  Slider(start=0, end=autompg.shape[0], value=0, name='my_slider', visible=False)
text = pn.widgets.TextInput(value='Ready')
# pn.Row(slider)

script = """
<script>
if (document.readyState === "complete") {

   var table = $('.example').DataTable({
                                    "columnDefs": [
                                        {"className": "dt-left", "targets": "_all"}
                                      ]
                                  });


  $('.example tbody').on('click', 'tr', function ()
                {
                    var data = table.row( this ).data();

                    var slider = Bokeh.documents[0].get_model_by_name('my_slider');
                    console.log('slider value before:', slider.value);
                    slider.value = Number(data[0]);
                    console.log('slider value after:', slider.value);

                } ) ;


} else {
  $(document).ready(function () {
    $('.example').DataTable({
    "columnDefs": [ {"className": "dt-left", "targets": "_all"}  ]
  });
  })
}
</script>
"""

def dummy_call(attr, old, new):
    text.value = autompg.loc[slider.value]['name']
    return


slider.on_change('value', dummy_call)


html = autompg.to_html(classes=['example', 'panel-df'])
table_pane = pn.pane.HTML(html+script, sizing_mode='stretch_width')

pn.Column(slider, text, table_pane).show()
The slider of bokeh (invisible) is need because when you use get_model_by_name and the panel widgets do not have the name property.
If you need to style the table you can use the theme creator
https://datatables.net/manual/styling/theme-creator
and load the resulting css with
pn.extension(css_files=css, js_files=js, raw_css = raw_css)
best regards,
Nestor.