I had a code routine that I´ve used to plot some graphics of some modelling results. It was working fine till today!.
One of these graphics is an Area graphic. I generated a lot of different areas from a table with my results (labelling each of the areas with a different name) and saved them in a list. After that, I generated an overlay (using hv.Overlay(area_list). No problem here! If i plot the overlay, it shows the areas overlayed. As I want to see these areas objects stacked I used (in my previous code) the function hv.Area.stack(overlay). It was working, but now it doesn´t show anything! Just a blank plot! I believe it´s a bug

Try posting a minimum reproducible example. It’s almost impossible to help without. Thanks.
Minimum reproducible examples are invaluable.
Confirm that your x-axis scale/limits have not changed. Your first figure does not show the x-axis scale. There is a possibility that you have scaled out too far to see your plot.
Okay! I´m gonna try to explain exactly what I´ve done.
I have this dataframe:
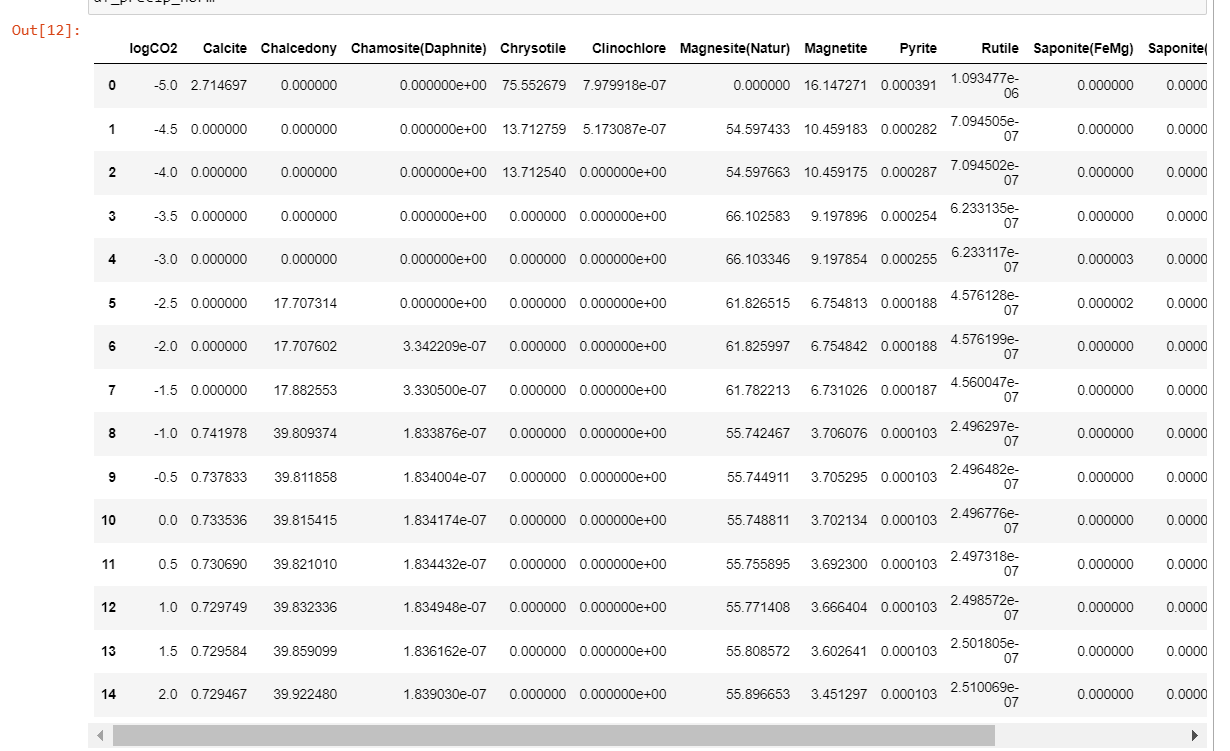
Excluding the first column (logCO2), I used the following code to create an area of each column and put each area in a list that I´ve created (area_list_p):
key_dimensions = [(‘logCO2’, ‘logCO2’)]
area_list_p = []
for mineral in minerais_precip:
area_list_p.append(hv.Area(df_precip_norm, kdims= key_dimensions, vdims= mineral, label=mineral).opts(
alpha=0.4, muted_fill_alpha=0, xlim=(-5, 3), ylim=(0,100)))
“minerais_precip” is a list that I´ve created with the name of the columns of my data frame (excluding the first column).
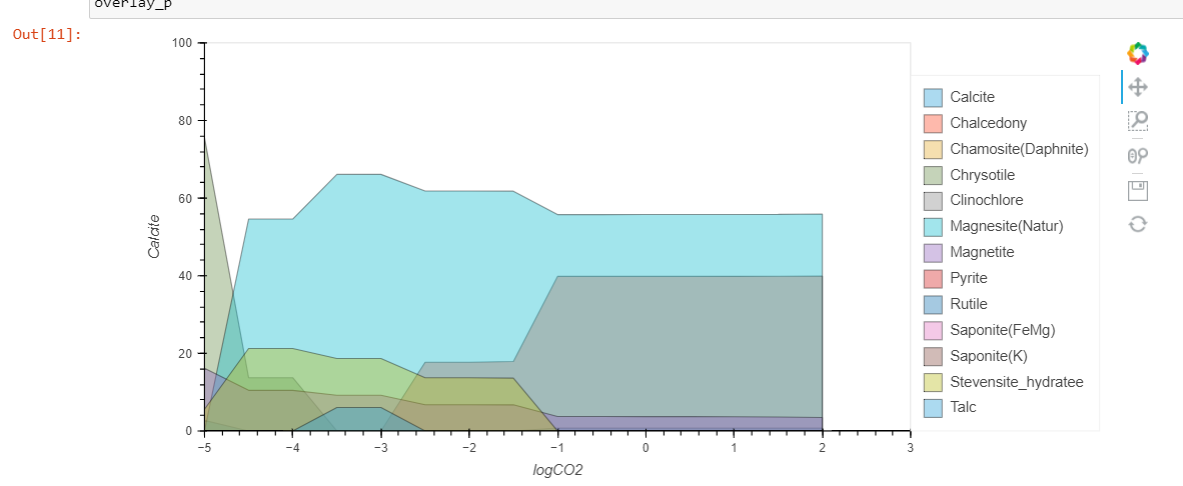
After that, I´ve created an overlay object to overlay each area of my “area_list_p” using:
overlay_p = hv.Overlay(area_list_p).opts(
width=900, height=400, legend_position=‘right’, yaxis=‘left’)
Here is the plot:
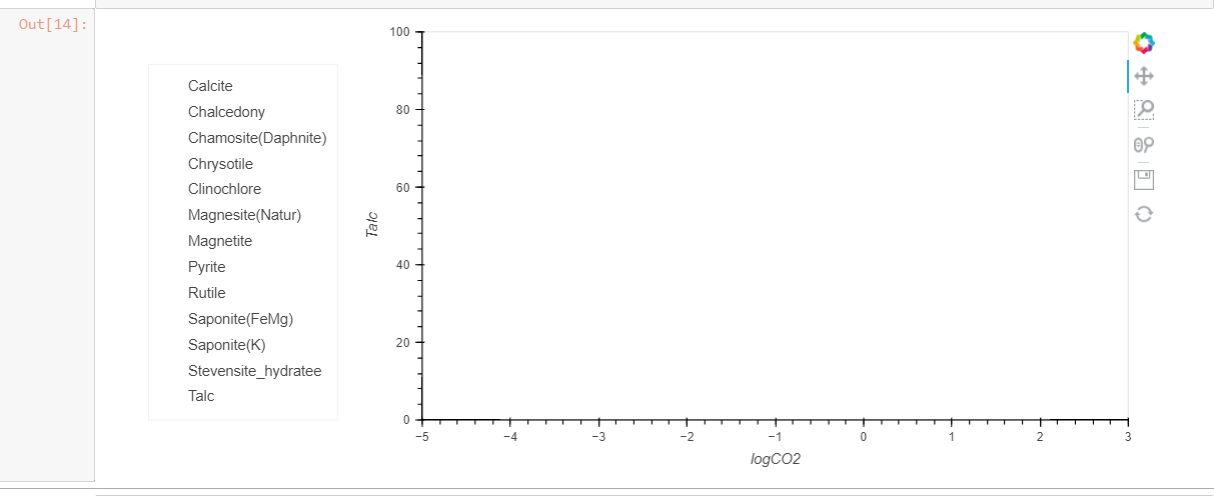
And then I´ve tried to make an stacked area plot from that overlay_p using:
hv.Area.stack(overlay_p).opts(
width=400, height=700, legend_position=‘left’)
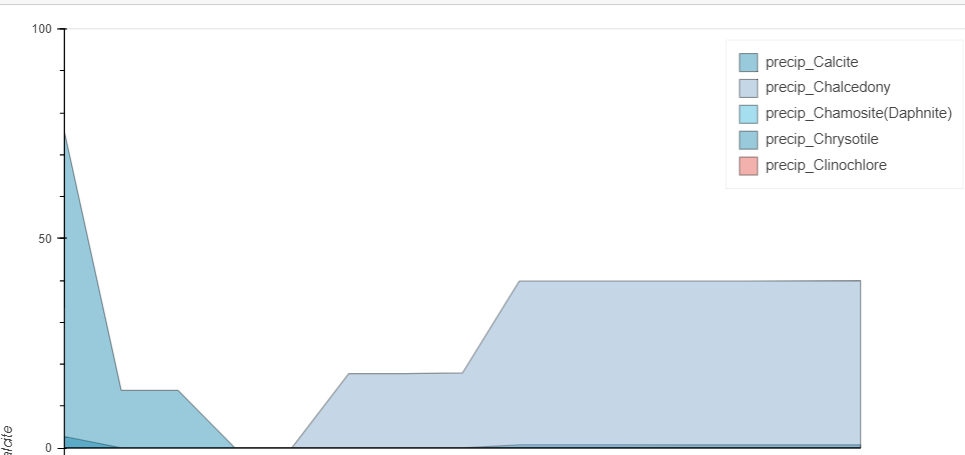
And my plot is in blank, like this:
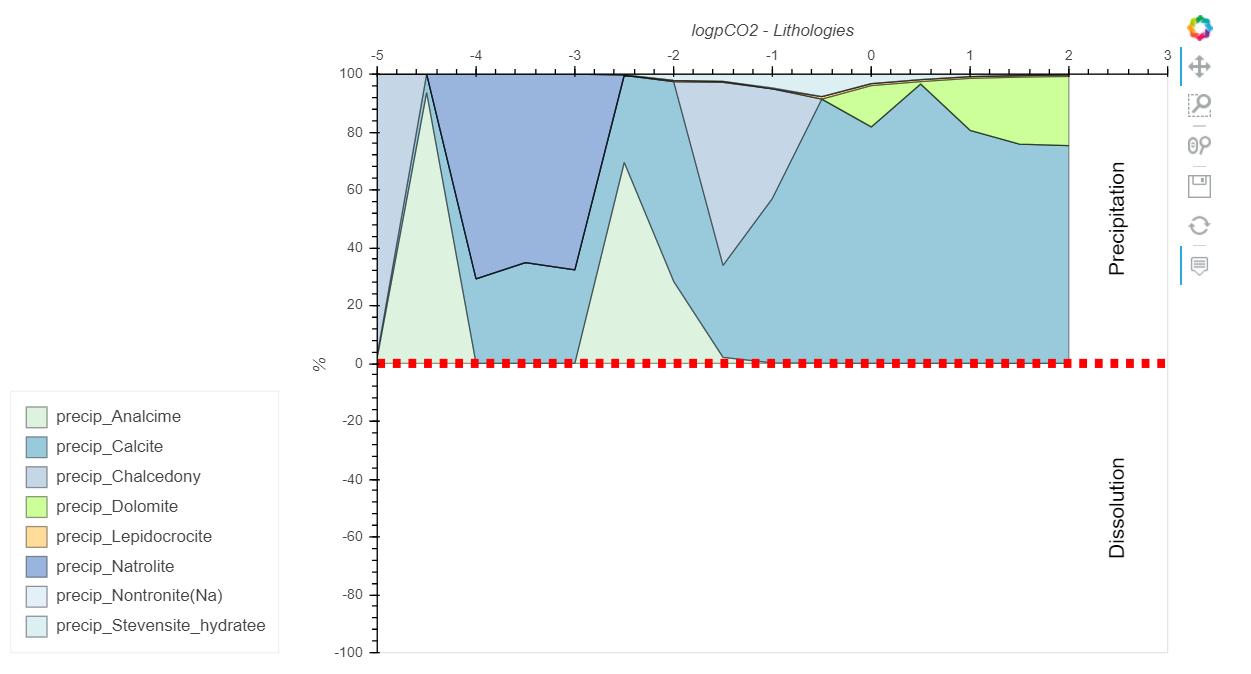
I´ve used that same kind of routine before and it was working perfectly. Here is one example of that before: