I created this example of a publication quality bar chart inspired by A Complete Guide to Bar Charts | Atlassian.
Wanted to share and persist it because it took some experimentation and time to create.
Code
# ============================================================================
# Publication-Quality Bar Chart - hvPlot Best Practices Example
# ============================================================================
# Demonstrates:
# - Data extraction, transformation, and visualization separation
# - Custom Bokeh themes for consistent styling
# - Interactive tooltips with formatted data
# - Text annotations on bars
# - Professional fonts, grids, and axis formatting
# - Panel integration for web serving
# ============================================================================
import hvplot.pandas # noqa: F401
import panel as pn
import hvsampledata
from bokeh.models.formatters import NumeralTickFormatter
from bokeh.themes import Theme
import holoviews as hv
from holoviews.plotting.bokeh import ElementPlot
# ============================================================================
# BOKEH THEME SETUP - Define global styling
# ============================================================================
ACCENT_COLOR = '#007ACC' # Professional blue
def create_bokeh_theme(font_family='Roboto', accent_color=ACCENT_COLOR):
"""Create custom theme with specified font. Default: Roboto"""
return Theme(json={
'attrs': {
'Title': {
'text_font': font_family,
'text_font_size': '16pt',
'text_font_style': 'bold'
},
'Axis': {
'axis_label_text_font': font_family,
'axis_label_text_font_size': '12pt',
'axis_label_text_font_style': 'bold',
'major_label_text_font': font_family,
'major_label_text_font_size': '10pt',
'major_tick_line_color': "black", # Remove tick marks
'minor_tick_line_color': None
},
'Plot': {
'background_fill_color': '#fafafa',
'border_fill_color': '#fafafa'
},
'Legend': {
'label_text_font': font_family,
'label_text_font_size': '10pt'
},
'Toolbar': {
"autohide": True,
"logo": None,
"stylesheets": [
f"""
.bk-OnOffButton.bk-active{{
border-color: {accent_color} !important;
}}
"""
]
},
# Does not work via Theme, so added here for reference purposes until I figure out how to do it
'Tooltip': {
"stylesheets": [f"""
.bk-tooltip-row-label {{
color: {ACCENT_COLOR} !important;
}}"""]
}
}
})
# Apply theme globally - affects all plots
hv.renderer('bokeh').theme = create_bokeh_theme()
# ============================================================================
# HOLOVIEWS OPTS SETUP - Define global configuration
# ============================================================================
GLOBAL_BACKEND_OPTS={
'plot.xgrid.visible': False, # Only horizontal grid lines
'plot.ygrid.visible': True,
'plot.ygrid.grid_line_color': "black",
'plot.ygrid.grid_line_alpha': 0.1,
'plot.min_border_left': 80, # Add padding on left (for y-axis label)
'plot.min_border_bottom': 80, # Add padding on bottom (for x-axis label)
'plot.min_border_right': 30, # Add padding on right
'plot.min_border_top': 80, # Add padding on top
}
ElementPlot.param.backend_opts.default = GLOBAL_BACKEND_OPTS
ElementPlot.param.yformatter.default = NumeralTickFormatter(format='0a') # 1k,
hv.opts.defaults(
hv.opts.Bars(
color=ACCENT_COLOR, # Professional blue
line_color=None, # Remove bar borders
),
hv.opts.Labels(
text_baseline='bottom',
text_font_size='11pt',
text_font_style='normal',
text_color='#333333',
),
)
hv.Cycle.default_cycles["default_colors"] = [ACCENT_COLOR, '#00948A', '#7E59BD', '#FFA20C', '#DA4341', '#D6F1FF', '#DAF5F4', '#F0E8FF', '#FFF8EA', '#FFF1EA', '#001142', '#003336', '#290031', '#371F00', '#3A0C13']
# ============================================================================
# DATA PIPELINE - Separate extraction, transformation, and plotting
# ============================================================================
def get_earthquake_data():
"""Extract raw earthquake data from sample dataset"""
return hvsampledata.earthquakes("pandas")
def aggregate_by_magnitude(earthquake_data):
"""Transform: Group earthquakes by magnitude class with statistics"""
# Aggregate: count events and calculate average depth per magnitude class
aggregated = (
earthquake_data
.groupby('mag_class', observed=True)
.agg({'mag': 'count', 'depth': 'mean'})
.reset_index()
.rename(columns={'mag': 'event_count', 'depth': 'avg_depth'})
.sort_values('event_count', ascending=False)
)
# Add percentage column for tooltips
aggregated['percentage'] = (
aggregated['event_count'] / aggregated['event_count'].sum() * 100
)
return aggregated
def create_bar_chart(aggregated_data):
"""Create publication-quality bar chart with labels and tooltips"""
default_tools=['save']
# Main bar chart with professional styling
bar_chart = aggregated_data.hvplot.bar(
x='mag_class',
y='event_count',
# Titles and labels
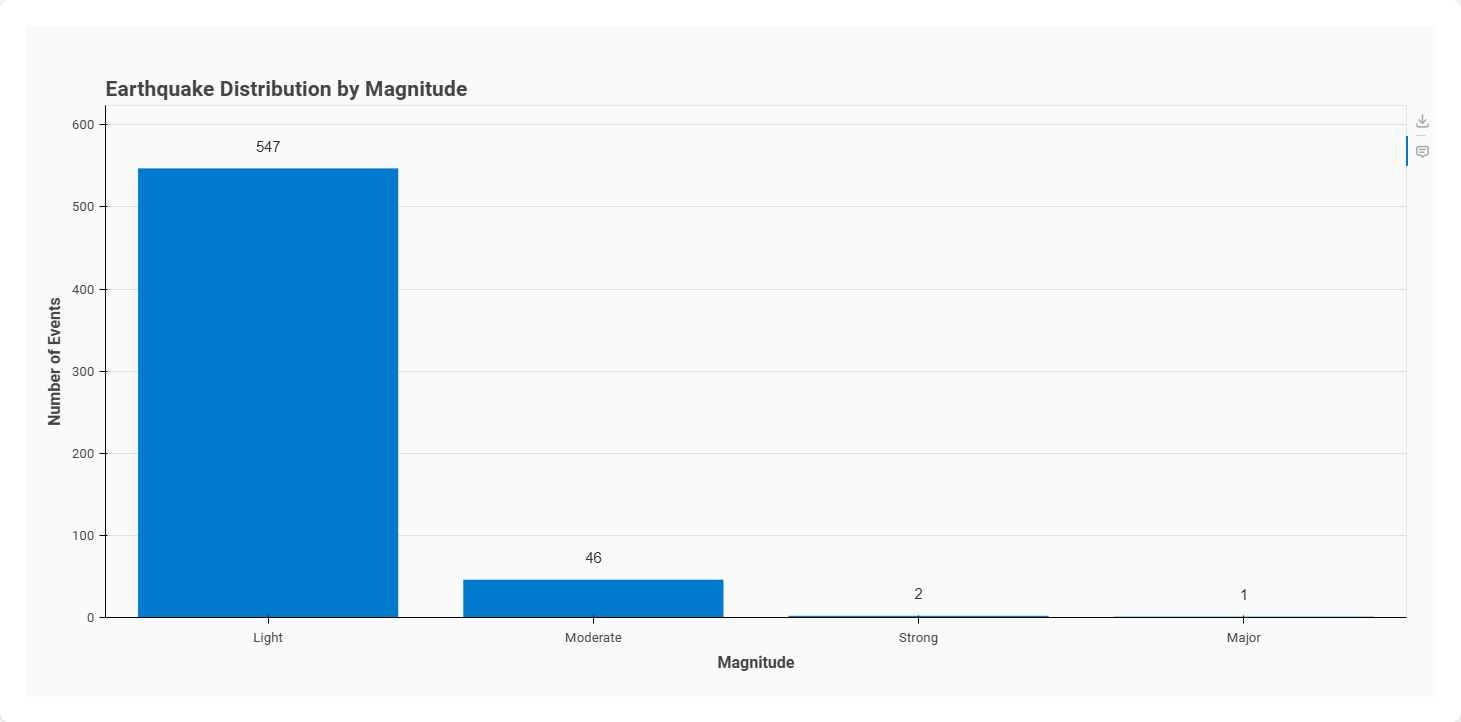
title='Earthquake Distribution by Magnitude',
xlabel='Magnitude',
ylabel='Number of Events',
# Interactivity
hover_cols = ["mag_class", "event_count", "percentage", "avg_depth"],
hover_tooltips=[
('Magnitude', '@mag_class'),
('Events', '@event_count{0,0}'), # Format: 1,234
('Percentage', '@percentage{0 a}%'), # Format: 45.7%
('Avg Depth', '@avg_depth{0f} km') # Format: 99 km
],
).opts(default_tools=default_tools)
# Add text labels above bars
labels_data = aggregated_data.copy()
labels_data['label_y'] = labels_data['event_count'] + 20 # Offset above bars
text_labels = labels_data.hvplot.labels(
x='mag_class',
y='label_y',
text='event_count',
hover_cols = ["mag_class", "event_count"],
hover_tooltips=[
('Magnitude', '@mag_class'),
('Events', '@event_count{0,0}'), # Format: 1,234
],
).opts(default_tools=default_tools)
# Overlay: bar chart * text labels
return bar_chart * text_labels
def create_plot():
"""Main function: Extract → Transform → Plot"""
# Extract: Get raw data
earthquake_data = get_earthquake_data()
# Transform: Aggregate and calculate statistics
aggregated = aggregate_by_magnitude(earthquake_data)
# Visualize: Create publication-quality chart
chart = create_bar_chart(aggregated)
return chart
# ============================================================================
# PANEL APP SETUP
# ============================================================================
# Serve the chart when running with Panel
if pn.state.served:
# Load Panel JavaScript extensions
pn.extension()
# Apply custom Bokeh theme (override the global theme)
# Create and serve the chart
chart = create_plot()
pn.panel(chart, sizing_mode="stretch_both", margin=25).servable()
Serve with
panel serve script.py
I could not
- Figure out how to set the color of the tooltip text (change it from light blue to ACCENT_COLOR)
- Add additional tooltips to the labels. See HoloViews #6769