Hello,
I am trying to deploy a really simple application using barely no external libraries.
Here is the code :
from io import StringIO
import panel as pn
import pandas as pd
import param
from sklearn import decomposition, manifold
from bokeh.models import ColumnDataSource, LabelSet, HoverTool, SaveTool, PanTool, WheelZoomTool, FuncTickFormatter
from bokeh.plotting import figure

pn.extension(notifications=True)
pn.extension('tabulator')

iris_data_str = """Id,SepalLengthCm,SepalWidthCm,PetalLengthCm,PetalWidthCm,Species
1,5.1,3.5,1.4,0.2,Iris-setosa
2,4.9,3.0,1.4,0.2,Iris-setosa
3,4.7,3.2,1.3,0.2,Iris-setosa
4,4.6,3.1,1.5,0.2,Iris-setosa
5,5.0,3.6,1.4,0.2,Iris-setosa
6,5.4,3.9,1.7,0.4,Iris-setosa
7,4.6,3.4,1.4,0.3,Iris-setosa
8,5.0,3.4,1.5,0.2,Iris-setosa
9,4.4,2.9,1.4,0.2,Iris-setosa
10,4.9,3.1,1.5,0.1,Iris-setosa
11,5.4,3.7,1.5,0.2,Iris-setosa
12,4.8,3.4,1.6,0.2,Iris-setosa
13,4.8,3.0,1.4,0.1,Iris-setosa
14,4.3,3.0,1.1,0.1,Iris-setosa
15,5.8,4.0,1.2,0.2,Iris-setosa
16,5.7,4.4,1.5,0.4,Iris-setosa
17,5.4,3.9,1.3,0.4,Iris-setosa
18,5.1,3.5,1.4,0.3,Iris-setosa
19,5.7,3.8,1.7,0.3,Iris-setosa
20,5.1,3.8,1.5,0.3,Iris-setosa
21,5.4,3.4,1.7,0.2,Iris-setosa
22,5.1,3.7,1.5,0.4,Iris-setosa
23,4.6,3.6,1.0,0.2,Iris-setosa
24,5.1,3.3,1.7,0.5,Iris-setosa
25,4.8,3.4,1.9,0.2,Iris-setosa
26,5.0,3.0,1.6,0.2,Iris-setosa
27,5.0,3.4,1.6,0.4,Iris-setosa
28,5.2,3.5,1.5,0.2,Iris-setosa
29,5.2,3.4,1.4,0.2,Iris-setosa
30,4.7,3.2,1.6,0.2,Iris-setosa
31,4.8,3.1,1.6,0.2,Iris-setosa
32,5.4,3.4,1.5,0.4,Iris-setosa
33,5.2,4.1,1.5,0.1,Iris-setosa
34,5.5,4.2,1.4,0.2,Iris-setosa
35,4.9,3.1,1.5,0.1,Iris-setosa
36,5.0,3.2,1.2,0.2,Iris-setosa
37,5.5,3.5,1.3,0.2,Iris-setosa
38,4.9,3.1,1.5,0.1,Iris-setosa
39,4.4,3.0,1.3,0.2,Iris-setosa
40,5.1,3.4,1.5,0.2,Iris-setosa
41,5.0,3.5,1.3,0.3,Iris-setosa
42,4.5,2.3,1.3,0.3,Iris-setosa
43,4.4,3.2,1.3,0.2,Iris-setosa
44,5.0,3.5,1.6,0.6,Iris-setosa
45,5.1,3.8,1.9,0.4,Iris-setosa
46,4.8,3.0,1.4,0.3,Iris-setosa
47,5.1,3.8,1.6,0.2,Iris-setosa
48,4.6,3.2,1.4,0.2,Iris-setosa
49,5.3,3.7,1.5,0.2,Iris-setosa
50,5.0,3.3,1.4,0.2,Iris-setosa
51,7.0,3.2,4.7,1.4,Iris-versicolor
52,6.4,3.2,4.5,1.5,Iris-versicolor
53,6.9,3.1,4.9,1.5,Iris-versicolor
54,5.5,2.3,4.0,1.3,Iris-versicolor
55,6.5,2.8,4.6,1.5,Iris-versicolor
56,5.7,2.8,4.5,1.3,Iris-versicolor
57,6.3,3.3,4.7,1.6,Iris-versicolor
58,4.9,2.4,3.3,1.0,Iris-versicolor
59,6.6,2.9,4.6,1.3,Iris-versicolor
60,5.2,2.7,3.9,1.4,Iris-versicolor
61,5.0,2.0,3.5,1.0,Iris-versicolor
62,5.9,3.0,4.2,1.5,Iris-versicolor
63,6.0,2.2,4.0,1.0,Iris-versicolor
64,6.1,2.9,4.7,1.4,Iris-versicolor
65,5.6,2.9,3.6,1.3,Iris-versicolor
66,6.7,3.1,4.4,1.4,Iris-versicolor
67,5.6,3.0,4.5,1.5,Iris-versicolor
68,5.8,2.7,4.1,1.0,Iris-versicolor
69,6.2,2.2,4.5,1.5,Iris-versicolor
70,5.6,2.5,3.9,1.1,Iris-versicolor
71,5.9,3.2,4.8,1.8,Iris-versicolor
72,6.1,2.8,4.0,1.3,Iris-versicolor
73,6.3,2.5,4.9,1.5,Iris-versicolor
74,6.1,2.8,4.7,1.2,Iris-versicolor
75,6.4,2.9,4.3,1.3,Iris-versicolor
76,6.6,3.0,4.4,1.4,Iris-versicolor
77,6.8,2.8,4.8,1.4,Iris-versicolor
78,6.7,3.0,5.0,1.7,Iris-versicolor
79,6.0,2.9,4.5,1.5,Iris-versicolor
80,5.7,2.6,3.5,1.0,Iris-versicolor
81,5.5,2.4,3.8,1.1,Iris-versicolor
82,5.5,2.4,3.7,1.0,Iris-versicolor
83,5.8,2.7,3.9,1.2,Iris-versicolor
84,6.0,2.7,5.1,1.6,Iris-versicolor
85,5.4,3.0,4.5,1.5,Iris-versicolor
86,6.0,3.4,4.5,1.6,Iris-versicolor
87,6.7,3.1,4.7,1.5,Iris-versicolor
88,6.3,2.3,4.4,1.3,Iris-versicolor
89,5.6,3.0,4.1,1.3,Iris-versicolor
90,5.5,2.5,4.0,1.3,Iris-versicolor
91,5.5,2.6,4.4,1.2,Iris-versicolor
92,6.1,3.0,4.6,1.4,Iris-versicolor
93,5.8,2.6,4.0,1.2,Iris-versicolor
94,5.0,2.3,3.3,1.0,Iris-versicolor
95,5.6,2.7,4.2,1.3,Iris-versicolor
96,5.7,3.0,4.2,1.2,Iris-versicolor
97,5.7,2.9,4.2,1.3,Iris-versicolor
98,6.2,2.9,4.3,1.3,Iris-versicolor
99,5.1,2.5,3.0,1.1,Iris-versicolor
100,5.7,2.8,4.1,1.3,Iris-versicolor
101,6.3,3.3,6.0,2.5,Iris-virginica
102,5.8,2.7,5.1,1.9,Iris-virginica
103,7.1,3.0,5.9,2.1,Iris-virginica
104,6.3,2.9,5.6,1.8,Iris-virginica
105,6.5,3.0,5.8,2.2,Iris-virginica
106,7.6,3.0,6.6,2.1,Iris-virginica
107,4.9,2.5,4.5,1.7,Iris-virginica
108,7.3,2.9,6.3,1.8,Iris-virginica
109,6.7,2.5,5.8,1.8,Iris-virginica
110,7.2,3.6,6.1,2.5,Iris-virginica
111,6.5,3.2,5.1,2.0,Iris-virginica
112,6.4,2.7,5.3,1.9,Iris-virginica
113,6.8,3.0,5.5,2.1,Iris-virginica
114,5.7,2.5,5.0,2.0,Iris-virginica
115,5.8,2.8,5.1,2.4,Iris-virginica
116,6.4,3.2,5.3,2.3,Iris-virginica
117,6.5,3.0,5.5,1.8,Iris-virginica
118,7.7,3.8,6.7,2.2,Iris-virginica
119,7.7,2.6,6.9,2.3,Iris-virginica
120,6.0,2.2,5.0,1.5,Iris-virginica
121,6.9,3.2,5.7,2.3,Iris-virginica
122,5.6,2.8,4.9,2.0,Iris-virginica
123,7.7,2.8,6.7,2.0,Iris-virginica
124,6.3,2.7,4.9,1.8,Iris-virginica
125,6.7,3.3,5.7,2.1,Iris-virginica
126,7.2,3.2,6.0,1.8,Iris-virginica
127,6.2,2.8,4.8,1.8,Iris-virginica
128,6.1,3.0,4.9,1.8,Iris-virginica
129,6.4,2.8,5.6,2.1,Iris-virginica
130,7.2,3.0,5.8,1.6,Iris-virginica
131,7.4,2.8,6.1,1.9,Iris-virginica
132,7.9,3.8,6.4,2.0,Iris-virginica
133,6.4,2.8,5.6,2.2,Iris-virginica
134,6.3,2.8,5.1,1.5,Iris-virginica
135,6.1,2.6,5.6,1.4,Iris-virginica
136,7.7,3.0,6.1,2.3,Iris-virginica
137,6.3,3.4,5.6,2.4,Iris-virginica
138,6.4,3.1,5.5,1.8,Iris-virginica
139,6.0,3.0,4.8,1.8,Iris-virginica
140,6.9,3.1,5.4,2.1,Iris-virginica
141,6.7,3.1,5.6,2.4,Iris-virginica
142,6.9,3.1,5.1,2.3,Iris-virginica
143,5.8,2.7,5.1,1.9,Iris-virginica
144,6.8,3.2,5.9,2.3,Iris-virginica
145,6.7,3.3,5.7,2.5,Iris-virginica
146,6.7,3.0,5.2,2.3,Iris-virginica
147,6.3,2.5,5.0,1.9,Iris-virginica
148,6.5,3.0,5.2,2.0,Iris-virginica
149,6.2,3.4,5.4,2.3,Iris-virginica
150,5.9,3.0,5.1,1.8,Iris-virginica"""

data_file = StringIO(iris_data_str)
iris_data = pd.read_csv(data_file)

NEW_Y_AXIS_FORMATTER = FuncTickFormatter(code="""
                                             if (Math.abs(tick) < 1)
                                             {
                                                var unit = ''
                                                var num =  (tick).toFixed(1)
                                             }
                                             if (Math.abs(tick) < 1e3)
                                             {
                                                var unit = ''
                                                var num =  (tick).toFixed(0)
                                             }
                                             else if (Math.abs(tick) < 1e6)
                                             {
                                                var unit = 'K'
                                                var num =  (tick/1e3).toFixed(1)
                                             }
                                             else if (Math.abs(tick) < 1e9)
                                             {
                                                var unit = 'M'
                                                var num =  (tick/1e6).toFixed(1)
                                             }
                                             else
                                             {
                                                var unit = 'B'
                                                var num =  (tick/1e9).toFixed(1)
                                             }
                                             return `${num}${unit}`""")


LR_QUALITATIVE_COLORS_LONG = ["#1C2B7F", "#B63EAE", "#8ACDCE", "#F87018", "#742796", "#EE8B97", "#3D91BE", "#F99243", "#24448E",
                              "#F3ACA2", "#B8428C", "#B3DDCC", "#5E1F88", "#FBB56E", "#3577AE", "#FCC683", "#4D1A70", "#46AACE",
                              "#FAA358", "#DB5087", "#2D5E9E", "#F9812D", "#62BED2", "#E96A8D", "#73AE96", "#254764", "#E74CC4",
                              ]


class BasicScatterPlot:
    def __init__(self,
                 title,
                 tools,
                 x_axis_label="",
                 y_axis_label="",
                 tooltips="",
                 height=600,
                 width=1200,
                 ):

        self.x_axis_label = x_axis_label
        self.y_axis_label = y_axis_label
        self.title = title
        self.tools = tools
        self.tooltips = tooltips
        self.height = height
        self.width = width
        self.source = ColumnDataSource(data=dict(x=[], y=[], size=[], color=[]))

        if len(self.tooltips) > 0:
            self.hover = HoverTool(tooltips=self.tooltips)
            self.tools = [self.hover] + self.tools

        self.source = ColumnDataSource(
            data=dict(x=[], y=[], size=[], color=[], labels=[])
        )

        self.make_figure()

    def make_figure(self):
        # Create plot
        self.figure = figure(tools=self.tools, width=self.width, height=self.height)
        self.figure.scatter(x="x", y="y", size="size", color="color", source=self.source)

        # name of the x-axis
        if len(self.x_axis_label) > 0:
            self.figure.xaxis.axis_label = self.x_axis_label
        if len(self.y_axis_label) > 0:
            self.figure.yaxis.axis_label = self.y_axis_label

        # Labels
        labels = LabelSet(
            x="x",
            y="y",
            text="labels",
            x_offset=0,
            y_offset=0,
            text_font_size="6pt",
            source=self.source,
        )
        self.figure.add_layout(labels)

        self.figure.toolbar.logo = None
        self.figure.y_range.start = 0
        self.figure.x_range.range_padding = 0
        self.figure.yaxis.minor_tick_line_color = None
        self.figure.xaxis.major_tick_line_color = None
        self.figure.yaxis.major_tick_line_color = None
        self.figure.xaxis.minor_tick_line_color = None
        self.figure.outline_line_color = None

        self.figure.yaxis.formatter = NEW_Y_AXIS_FORMATTER


class Dashboard(param.Parameterized):
    switch_algorithm = param.ObjectSelector(default='PCA')
    refresh_button = param.Action(lambda x: x.param.trigger("refresh_button"), label="Refresh")
    n_neighbors = param.Integer(30)
    min_distance = param.Number(0.1)

    @param.depends("refresh_button", watch=True, on_init=False)
    def refresh(self):
        print("launching " + str(self.switch_algorithm))
        pn.state.notifications.info("launching " + str(self.switch_algorithm), duration=10000)
        self.update_dashboard()
        pn.state.notifications.success(str(self.switch_algorithm) + " has been executed", duration=10000)

    def __init__(self, plot, **params):
        super().__init__(**params)
        self.plot = plot

        self.iris_data = iris_data.drop("Id", axis=1)

        self.switch_algorithm_panel = pn.Param(
            self,
            name="",
            parameters=["switch_algorithm"],
            widgets={"switch_algorithm": pn.widgets.RadioButtonGroup(name='switch_algorithm', value='PCA',
                                                                     options=['PCA', 'T-SNE'],
                                                                     align='center', width=300)})

        self.refresh_button_panel = pn.Param(
            self,
            name="",
            parameters=["refresh_button"],
            widgets={"refresh_button": pn.widgets.Button(name='Refresh', align='center', width=300)})

        self.sidebar_layout = pn.Column(self.refresh_button_panel, self.switch_algorithm_panel)

        self.main_layout = pn.Column(self.plot.figure)

        self.update_dashboard()

    def create_color_list_multiclass(self, elements):
        color_list = []
        distincts_elements = list(set(elements))
        for elem in elements:
            color_list.append(LR_QUALITATIVE_COLORS_LONG[distincts_elements.index(elem)])
        return color_list

    def get_flat_list(self, data, col):
        res = data[col].values.tolist()
        flat_res = [item for sublist in res for item in sublist]
        return flat_res

    def reduce_dimension(self, data, column):
        data_no_class = data.drop(column, axis=1)
        if self.switch_algorithm == "PCA":
            results = self.launch_PCA(data_no_class)
        elif self.switch_algorithm == "T-SNE":
            results = self.launch_TSNE(data_no_class)
        results[column] = data[column]
        return results

    def launch_PCA(self, data):
        pca = decomposition.PCA(n_components=2)
        X_pca = pca.fit_transform(data)
        results = pd.DataFrame(X_pca, columns=[["0", "1"]])
        return results

    def launch_TSNE(self, data):
        tsne = manifold.TSNE(n_components=2, init='random', random_state=42, perplexity=30)
        X_tsne = tsne.fit_transform(data)
        results = pd.DataFrame(X_tsne, columns=[["0", "1"]])
        return results

    def update_dashboard(self):
        print("new value is selected :")
        print(self.switch_algorithm)

        projection_results = self.reduce_dimension(self.iris_data, column="Species")
        species = self.get_flat_list(projection_results, "Species")
        species_strings = [str(x) for x in species]

        first_axis = self.get_flat_list(projection_results, "0")
        second_axis = self.get_flat_list(projection_results, "1")

        iris_color_list = self.create_color_list_multiclass(species)

        self.plot.source.data = dict(
            labels=species_strings,
            x=first_axis,
            y=second_axis,
            size=[20] * len(species),
            color=iris_color_list,
        )


iris_projection_scatter_plot = BasicScatterPlot(title="Projection of Iris dataset in 2 dimensions",
                                                x_axis_label="",
                                                y_axis_label="",
                                                tools=[SaveTool(), PanTool(), WheelZoomTool()],
                                                height=500,
                                                width=1000,
                                                tooltips="""
                                                      <b>species: </b> @labels
                                                      """, )

simple_interactive_dash = Dashboard(iris_projection_scatter_plot)

tab_title = pn.pane.Str("Data overview", styles={'font-size': '20pt'})
tab = pn.widgets.Tabulator(simple_interactive_dash.iris_data, pagination='remote', page_size=10,
                           header_align='center', text_align="center",
                           layout='fit_data_stretch',
                           width=1000)

new_text = "This dashboard shows different visualisations of the iris dataset."
str_pane = pn.pane.Str(new_text)
about = pn.Card(str_pane, title='About this dashboard', width=1000)

plot_title = pn.pane.Str(iris_projection_scatter_plot.title, styles={'font-size': '20pt'})

template = pn.template.BootstrapTemplate(
    title="Plotting high dimensional data",
    sidebar=simple_interactive_dash.sidebar_layout,
    main=pn.Column(about, pn.Spacer(height=25), tab_title, tab,
                   pn.Spacer(height=25), plot_title, simple_interactive_dash.main_layout)
)

template.servable()
After converting this file using this command :
panel convert script.py --to pyodide-worker --out pyodide
and launching the server with this command :
python3 -m http.server
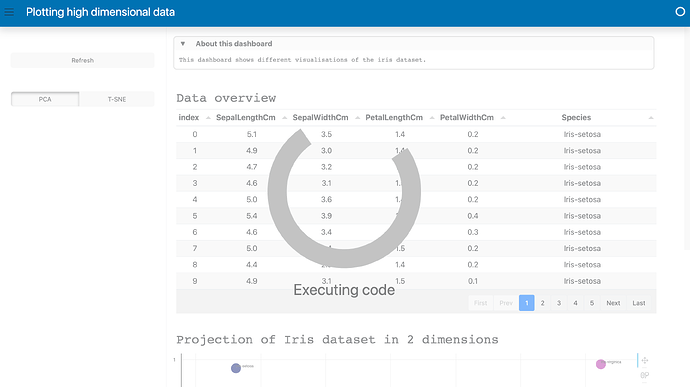
I am getting an infinite loading spinner with this caption : “Executing code”
What could be the problem ?
