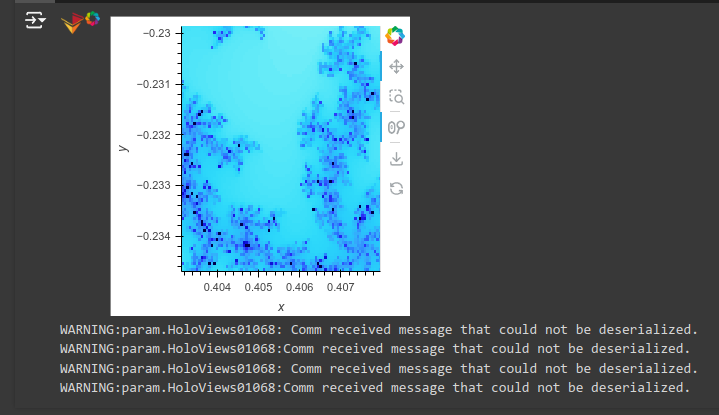
My understanding is the Colab was never designed for interactive data exploration with widgets and bidirectional communication. It has some security measures that makes it really slow for that use case.
Code
"""
## Explanation

The *Mandelbrot set* is a fascinating two-dimensional fractal that is defined by a simple mathematical formula but exhibits remarkable complexity, especially when magnified. It is widely known for its intricate patterns and aesthetic appeal.

The set is defined on the complex plane as the set of complex numbers $$ c $$ for which the iterative function $$ f_c(z) = z^2 + c $$ does not diverge to infinity when starting at $$ z = 0 $$. In other words, the sequence $$ f_c(0) $$, $$ f_c(f_c(0)) $$, and so on, remains bounded in absolute value.

In this implementation, the sequence is computed iteratively. The process stops if the magnitude of the number exceeds 4, indicating that it has diverged. The color in the resulting image reflects the number of iterations needed to determine if the point belongs to the Mandelbrot set.
"""

import colorcet as cc
import holoviews as hv
import numpy as np
import panel as pn
from holoviews.streams import RangeXY
from numba import jit

pn.extension("mathjax", loading_indicator=True, defer_load=True, nthreads=3)

# Hack can be removed when https://github.com/holoviz/panel/issues/7360 has been solved
CMAP_CSS_HACK = (
    "div, div:hover {background: var(--panel-surface-color); color: current}" if pn.config.theme == "dark" else ""
)

DEFAULT_COLOR_MAP = [
    "#0b2f4c",  # Deep blue
    "#164e80",  # Medium blue
    "#208ed6",  # Bright blue
    "#30a0e0",  # Aqua blue
    "#71c4f2",  # Light sky blue
    "#b4e4fa",  # Pale blue
    "#f5f1b8",  # Soft yellow
    "#f0c366",  # Light orange
    "#f28d35",  # Bright orange
    "#e0471e",  # Fiery red
    "#a83e1c",  # Deep red-brown
    "#662b12",  # Dark brown
    "#2d1107",  # Almost black
    "black",  # Pure black
]
ACCENT = DEFAULT_COLOR_MAP[1]


@jit
def mandel(x, y, max_iters):
    """
    Given the real and imaginary parts of a complex number,
    determine if it is a candidate for membership in the Mandelbrot
    set given a fixed number of iterations.
    """
    i = 0
    c = complex(x, y)
    z = 0.0j
    for i in range(max_iters):
        z = z * z + c
        if (z.real * z.real + z.imag * z.imag) >= 4:
            return i

    return 255


@jit
def create_fractal(min_x, max_x, min_y, max_y, image, iters):
    height = image.shape[0]
    width = image.shape[1]

    pixel_size_x = (max_x - min_x) / width
    pixel_size_y = (max_y - min_y) / height
    for x in range(width):
        real = min_x + x * pixel_size_x
        for y in range(height):
            imag = min_y + y * pixel_size_y
            color = mandel(real, imag, iters)
            image[y, x] = color

    return image


def get_fractal(x_range, y_range, iters=200, cmap="set1", width=1200, height=1200):
    (x0, x1), (y0, y1) = x_range, y_range
    image = np.zeros((width, height), dtype=np.uint8)
    return hv.Image(create_fractal(x0, x1, -y1, -y0, image, iters), bounds=(x0, y0, x1, y1), rtol=1e-9).opts(
        colorbar=True,
        cmap=cmap,
        xlabel="Real",
        ylabel="Imaginary",
        title="Complex Plane",
        clabel="Number of Iterations",
        clim=(0, 255),
        tools=["hover"],
    )


range_stream = RangeXY(x_range=(-1.0, 1.0), y_range=(-1.0, 1.0))

max_iterations = pn.widgets.IntSlider(value=200, start=1, end=254, name="Max Iterations")

height = pn.widgets.IntSlider(
    value=800,
    start=100,
    end=2000,
    name="Image height (pixels)",
)
width = pn.widgets.IntSlider(
    value=1000,
    start=100,
    end=2000,
    name="Image width (pixels)",
)


palette = {"default": DEFAULT_COLOR_MAP}
palette.update(cc.palette)
cmap = pn.widgets.ColorMap(
    value=DEFAULT_COLOR_MAP,
    options=palette,
    ncols=3,
    swatch_width=100,
    sizing_mode="stretch_width",
    name="Color Map",
    stylesheets=[CMAP_CSS_HACK],
)
dmap = hv.DynamicMap(
    pn.bind(
        get_fractal,
        iters=max_iterations,
        x_range=range_stream.param.x_range,
        y_range=range_stream.param.y_range,
        cmap=cmap,
        height=height,
        width=width,
    )
)
dmap_panel = pn.panel(dmap, height=height, width=width)
pn.template.FastListTemplate(
    site="Awesome Panel",
    site_url="./",
    title="Mandelbrot",
    sidebar=["## Settings", cmap, max_iterations, height, width, pn.pane.Markdown(__doc__)],
    main=[dmap_panel],
    accent=ACCENT,
    main_layout=None,
).servable()
