Hey guys
I have a plot with categorical x axis as follows:
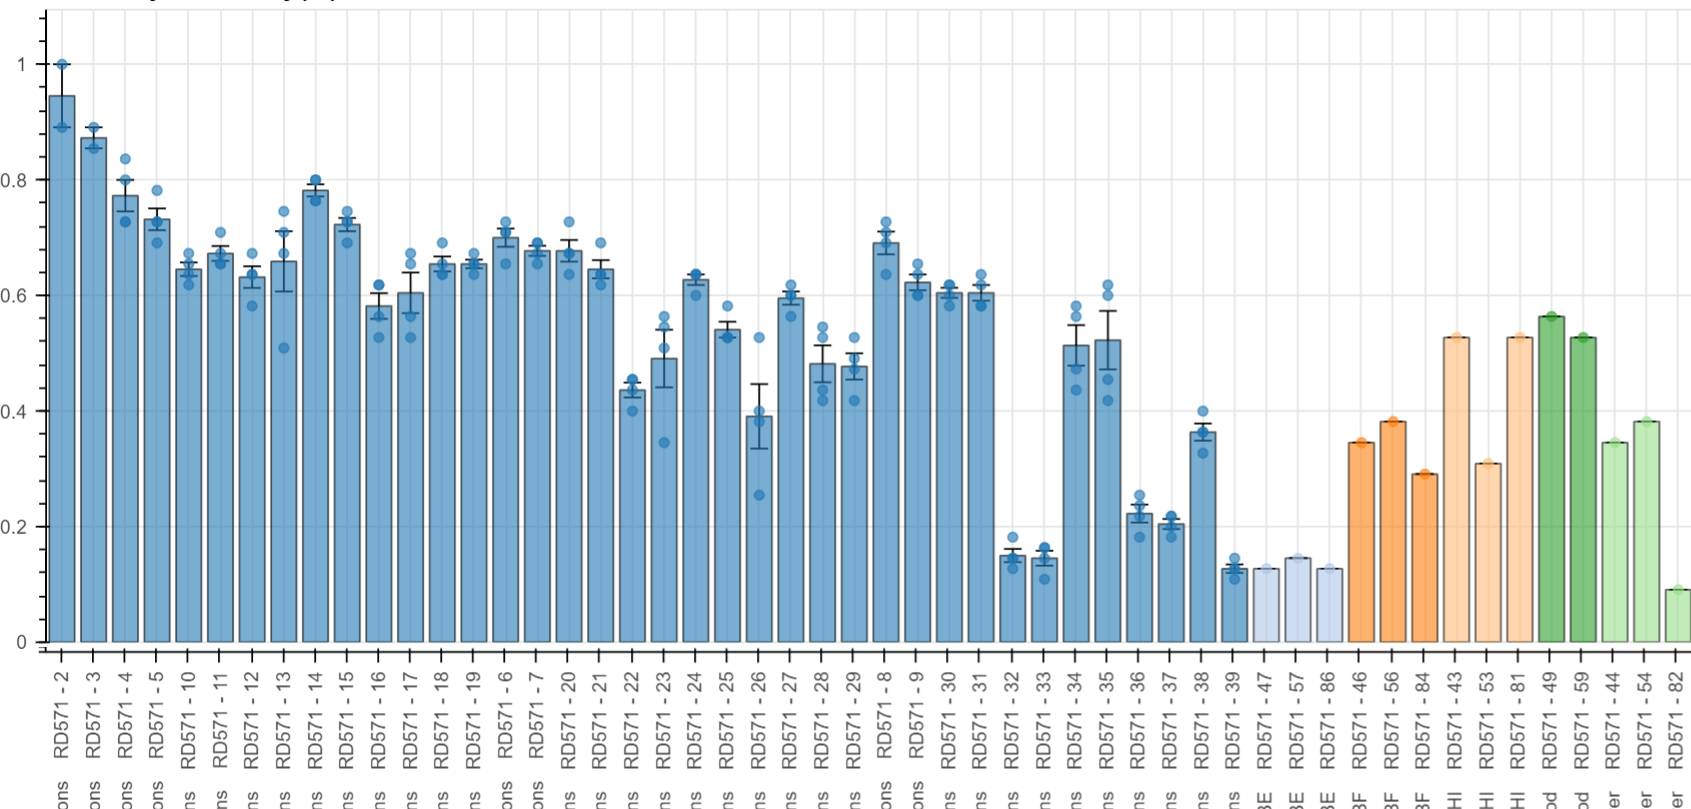
the names of the x values are assigned from a column in my df, but i wish to be able to change it dynamically based on the combination of other available columns in my df (that will be chosen using MultiChoice widget) , even if the same value is repeated multiple times.
Is this possible in any way?
another side question -
I have a plot and I wanna clone it and change it from bars to scatter, is it possible to clone and change the type? Or be able to choose plot type from a dropdown and change it dynamically…