Qmesh dynamic fill in?

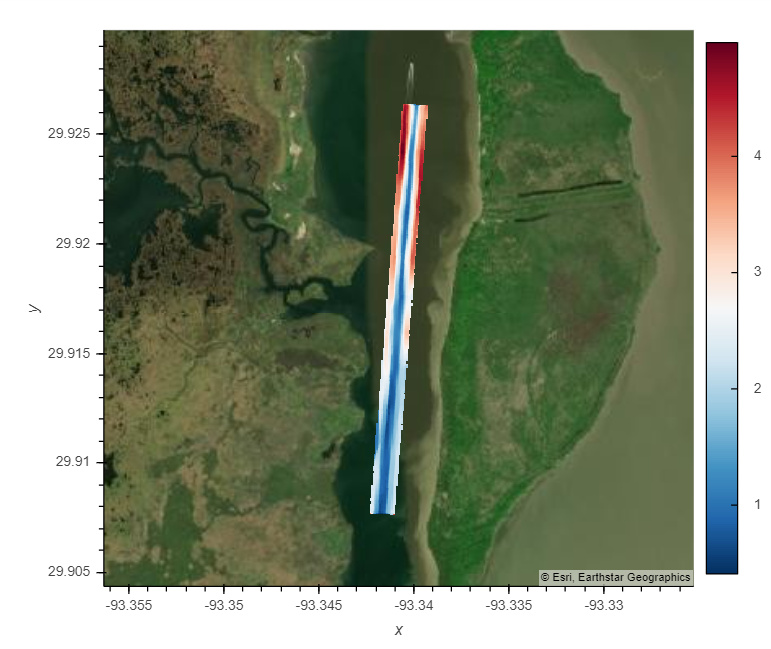
Plotting a grid to a map with a dynamic plot using qmesh. Xarray dataset is lats/lons and heights. Not sure if there is an easy fix to have a bigger sampling size for each raster cube.

shoal_grid = data_xr.hvplot.quadmesh(x='X_lon', y='Y_lat', rasterize=True, 
geo=True,dynamic=True)

geo_bg = hv.element.tiles.EsriImagery().opts(width=600, bgcolor='black')

tap = hv.streams.Tap(source=shoal_grid,x=-93.34010, y=29.92420)

def drilldown(x,y):
    test_point = np.argmin((x-lons)**2+(y-lats)**2)
    temp_ts = elvs.sel(points=test_point)
    temp_ts['time'] = time_series
    return temp_ts.hvplot.line(x='time',y='elevations',width=500,dynamic=False)

tap_dmap = hv.DynamicMap(drilldown, streams=[tap])

geo_bg*shoal_grid.opts(height=500, tools=['hover','box_select', 'lasso_select'],active_tools= 
['box_select'], **geo_opts) + tap_dmap

Zoomed in:

That’s quite bizarre and doesn’t seem like it should happen since I assume the data represents a contiguous grid, can’t quite tell without the data though. Is there some way to get the dataset?

https://csatdata.blob.core.windows.net/csat-csv-output/holoviews_share/

Heres the data that I use, the point of contention here is the .csv file

Getting this error:

This XML file does not appear to have any style information associated with it. The document tree is shown below.
<Error>
<Code>BlobNotFound</Code>
<Message>The specified blob does not exist. RequestId:33003406-201e-00bd-16d5-0630f3000000 Time:2021-02-19T15:38:08.1637334Z</Message>
</Error>

https://csatdata.blob.core.windows.net/csat-csv-output/holoviews_share/CR_19_LWR_09_avg_max_min.csv

This should work

@philippjfr have you tried to get this data?

https://csatdata.blob.core.windows.net/csat-netcdf-input/CR_19_LWR_09.nc

NetCDF file. Shouldn’t be needed for rasterization but included for the code above to run