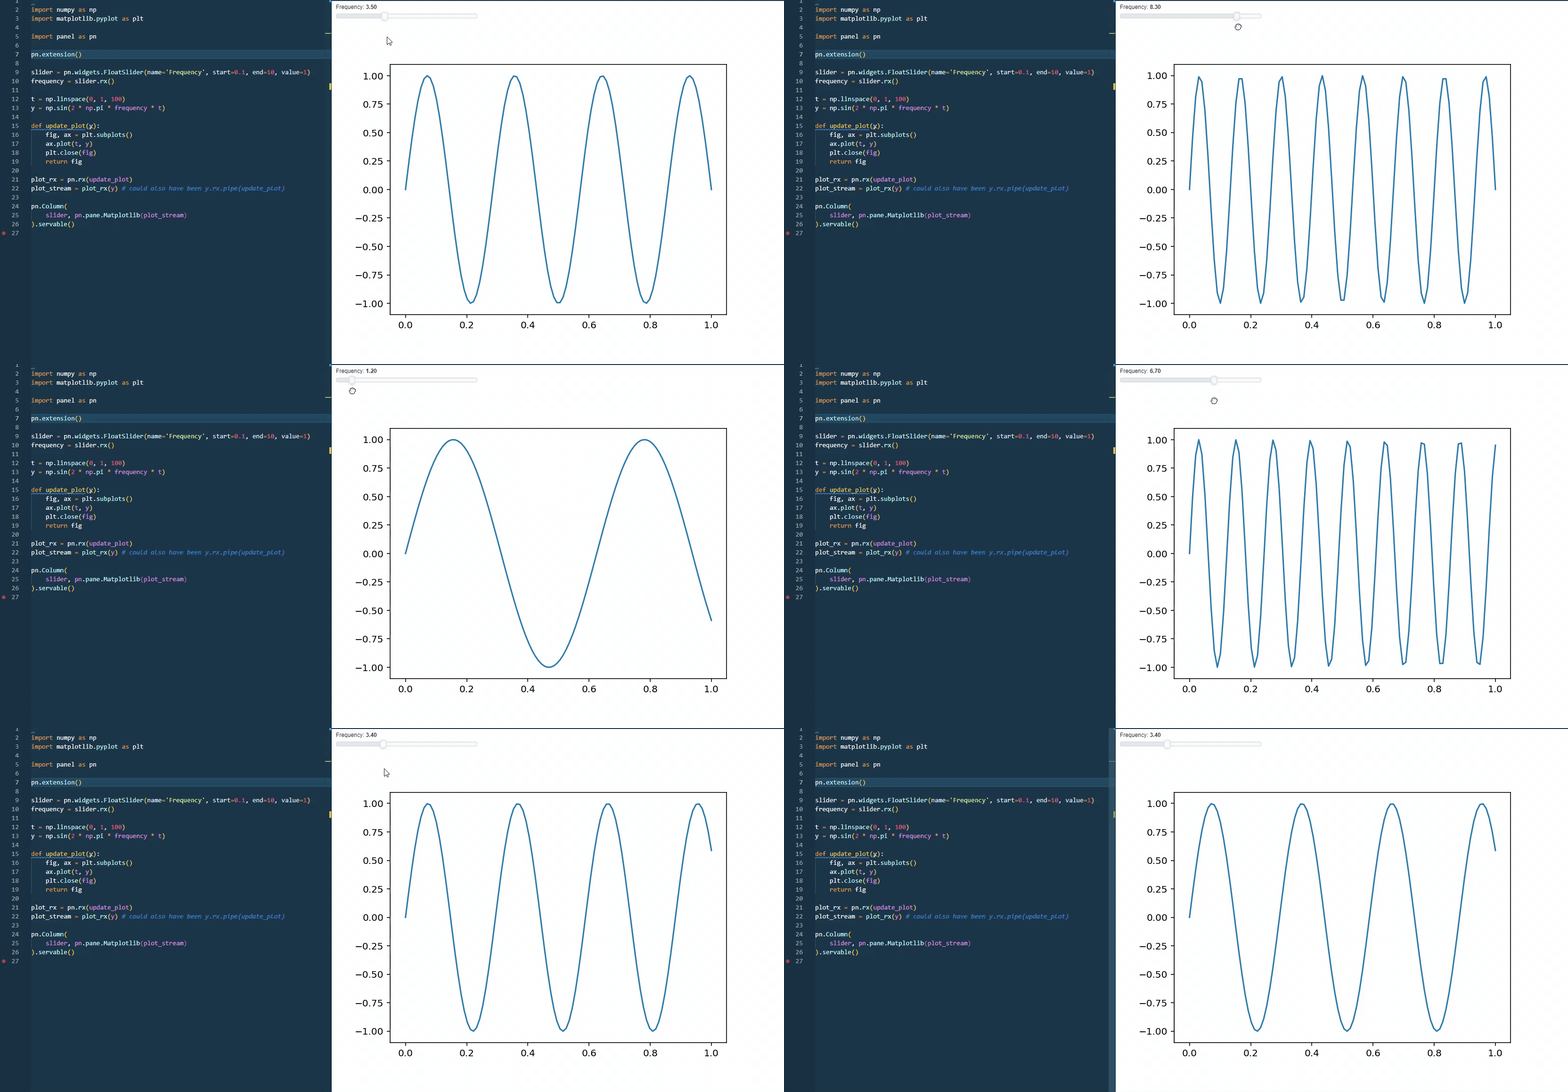
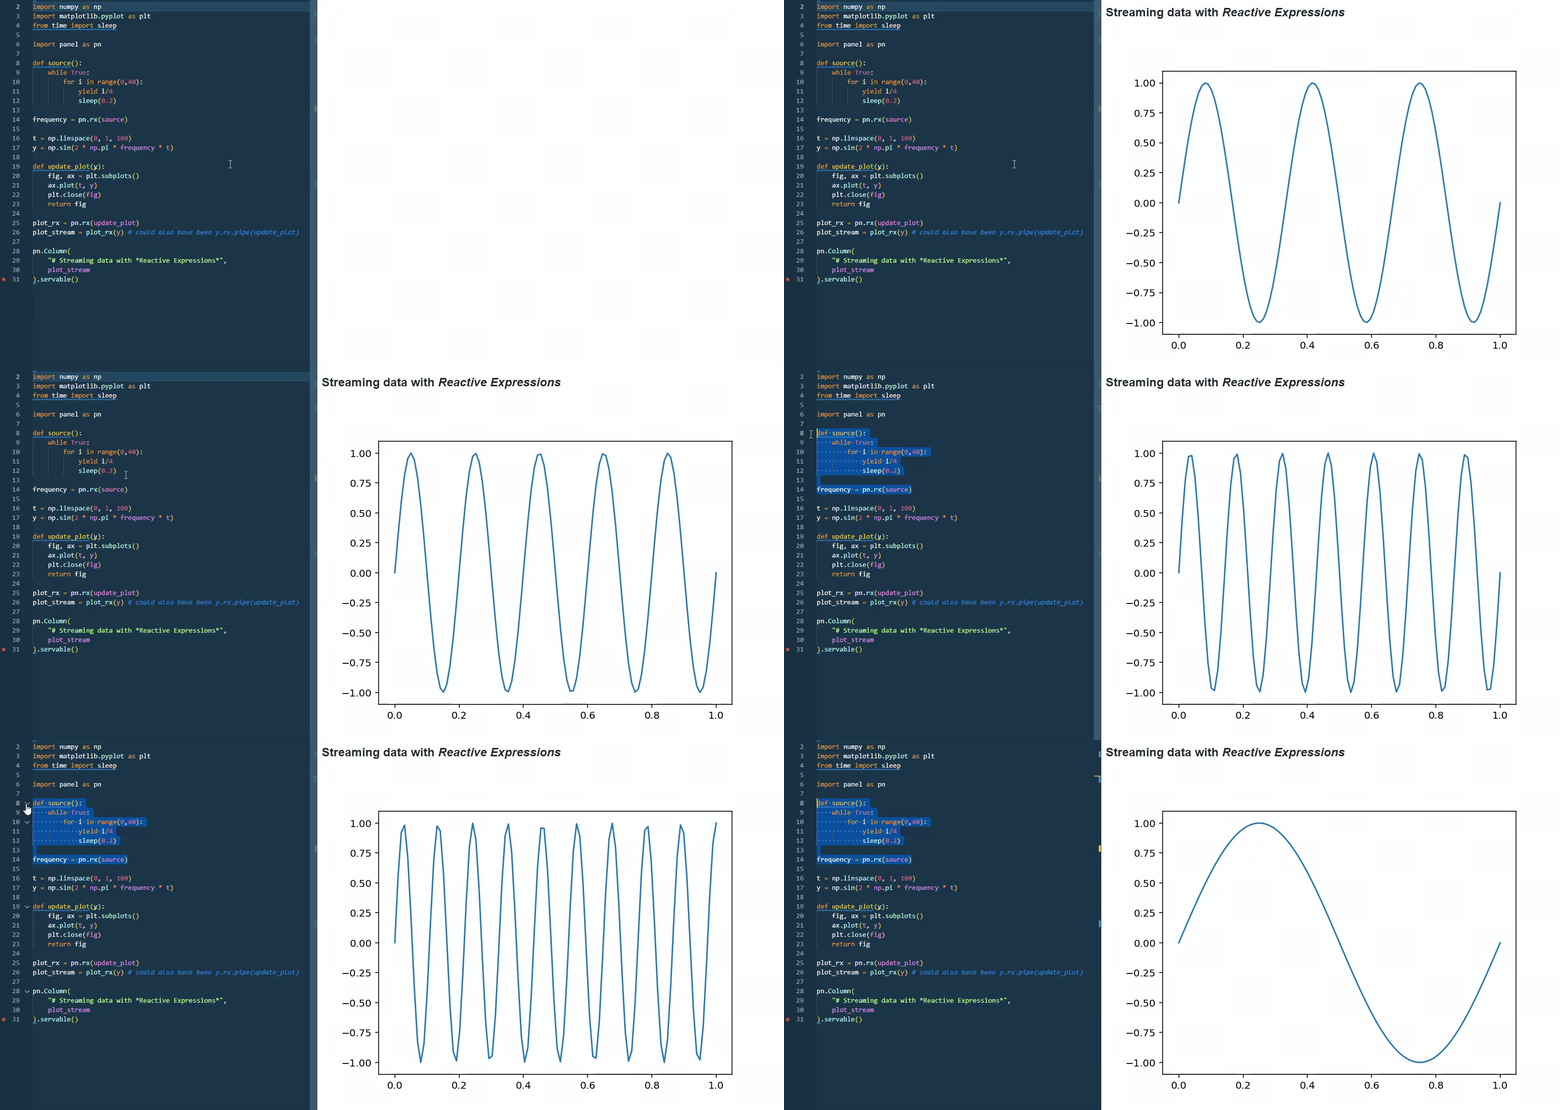
Reactive Expressions are new and very powerful. Just want to showcase their power
Start a Reactive Expression from a slider

import numpy as np
import matplotlib.pyplot as plt

import panel as pn

pn.extension()

slider = pn.widgets.FloatSlider(name='Frequency', start=0.1, end=10, value=1)
frequency = slider.rx()

t = np.linspace(0, 1, 100)
y = np.sin(2 * np.pi * frequency * t)

def update_plot(y):
    fig, ax = plt.subplots()
    ax.plot(t, y)
    plt.close(fig)
    return fig

plot_rx = pn.rx(update_plot)
plot_stream = plot_rx(y) # could also have been y.rx.pipe(update_plot)

pn.Column(
    slider, pn.pane.Matplotlib(plot_stream)
).servable()
Start a Reactive Expression from a generator function

import numpy as np
import matplotlib.pyplot as plt
from time import sleep

import panel as pn

def source():
    while True:
        for i in range(0,40):
            yield i/4
            sleep(0.2)

frequency = pn.rx(source)

t = np.linspace(0, 1, 100)
y = np.sin(2 * np.pi * frequency * t)

def update_plot(y):
    fig, ax = plt.subplots()
    ax.plot(t, y)
    plt.close(fig)
    return fig

plot_rx = pn.rx(update_plot)
plot_stream = plot_rx(y) # could also have been y.rx.pipe(update_plot)

pn.Column(
    "# Streaming data with *Reactive Expressions*",
    plot_stream
).servable()