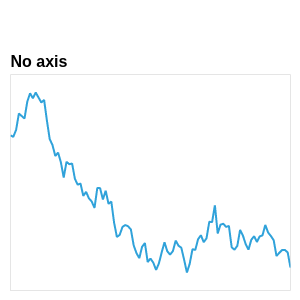
in any graph there is a subtle frame around the figure even if the axis of the plot is removed. Examples of this can be seen throughout the holoviews documentation, for instance here in section ‘Axis Position’: https://holoviews.org/user_guide/Customizing_Plots.html
For convinience, below is the image I’m referring to:
I would like to remove this frame. How would I go about doing that?
Any ideas would be appreciated.
Thanks for the quick reply, that looks promising!
But I’m not quite sure yet how to integrate this code into the setup for my graph.
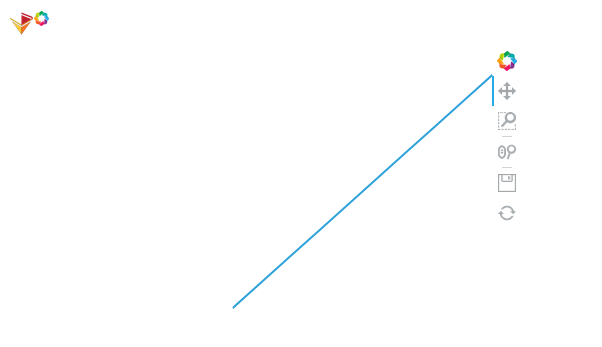
Below I’ve created a simplified graph with two nodes and one connecting edge.
I’ve removed the x-and y-axis already and now only need to get rid of the surrounding frame.
Could you please tell me what code line(s) I would need to add to my example?
import numpy as np
import holoviews as hv
hv.extension('bokeh')

# function that creates a graph with two nodes and one connecting edge and sets its edge color to the given
# function parameters
def hv_graph(edge_color):
    node_indices = np.arange(2, dtype=np.int32)
    source = np.zeros(2, dtype=np.int32)
    target = node_indices
    graph = hv.Graph(((source, target),)).opts(edge_color=edge_color)
    graph.opts(xaxis=None,yaxis=None, title="")
    return graph

def main():
    # create the dynamic map
    dmap = hv.DynamicMap(hv_graph, kdims=["edge_color"])
    dmap = dmap.redim.values(edge_color=["green", "black"])
    # save the dynamic map
    hv.save(dmap, 'dmap.html', backend='bokeh')
    return

if __name__ == '__main__':
    main()
I’ve tried to make a plot hook out of the blog entry provided by carl, but it doesn’t seem to work. I’m not too familiar with plot hooks or bokeh, so I might have made a mistake.
Could you give me some pointers on how to make the necessary plot hook?