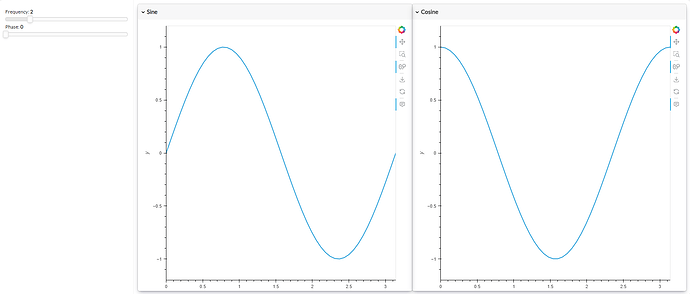
As a workaround you can use css
DISABLE_HEADER_CSS = """
nav#header {
    display: none;
}
"""

pn.extension(raw_css=[DISABLE_HEADER_CSS])
A full example would look like
import hvplot.pandas
import numpy as np
import panel as pn
import pandas as pd

DISABLE_HEADER_CSS = """
nav#header {
    display: none;
}
"""

pn.extension(raw_css=[DISABLE_HEADER_CSS])

xs = np.linspace(0, np.pi)

freq = pn.widgets.FloatSlider(name="Frequency", start=0, end=10, value=2)
phase = pn.widgets.FloatSlider(name="Phase", start=0, end=np.pi)

def sine(freq, phase):
    return pd.DataFrame(dict(y=np.sin(xs*freq+phase)), index=xs)

def cosine(freq, phase):
    return pd.DataFrame(dict(y=np.cos(xs*freq+phase)), index=xs)

dfi_sine = hvplot.bind(sine, freq, phase).interactive()
dfi_cosine = hvplot.bind(cosine, freq, phase).interactive()

plot_opts = dict(responsive=True, min_height=400)

# Instantiate the template with widgets displayed in the sidebar
template = pn.template.VanillaTemplate(
    title='VanillaTemplate',
    sidebar=[freq, phase],
)
# Append a layout to the main area, to demonstrate the list-like API
template.main.append(
    pn.Row(
        pn.Card(dfi_sine.hvplot(**plot_opts).output(), title='Sine'),
        pn.Card(dfi_cosine.hvplot(**plot_opts).output(), title='Cosine'),
    )
)

template.servable();
